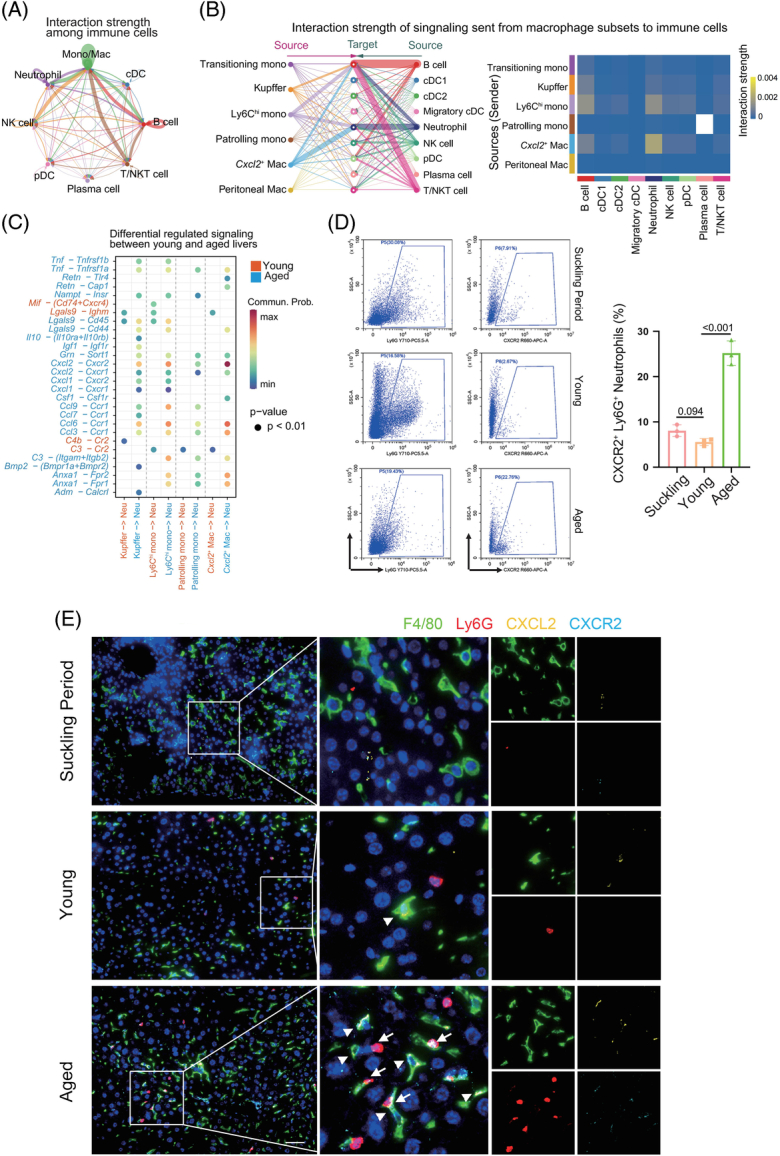
FIGURE 4.

Changes in ligand‒receptor interactions between different hepatic immune cell types in mice during aging. (A) Circle plot showing ligand‒receptor interaction strength between different hepatic immune cell types. The strength of the ligand‒receptor interaction is represented by the line thickness. (B) Hierarchical plot showing the inferred intercellular communication network for secreted signaling molecules with communication from monocyte/macrophage subtypes to the remaining immune cells (left). Heatmap showing the interaction strength between the monocyte/macrophage subtypes and remaining immune cells (right). (C) Bubble plot showing major differential ligand‒receptor pairs involved in monocytes/macrophages signaling to neutrophils, showing intensity in either young (red) or aged (blue) mice. (D) Representative flow cytometry plots of CXCR2+ Ly6G+ cells (CXCR2+ neutrophils) in the liver tissues of mice in the suckling, young, and aged periods (left, n=3). Percentage of CXCR2+ Ly6G+ cells in the mouse liver at the 3 ages (right). (E) Liver tissues from mice in the suckling, young, and aged periods underwent immunofluorescence staining for F4/80 (green fluorescence, macrophages), Ly6G (red fluorescence, neutrophils), CXCL2 (yellow fluorescence), or CXCR2 (blue fluorescence). Magnified images are shown in the middle column. Representative immunofluorescence images showing CXCL2 staining within macrophages (triangle marker) and CXCR2 staining on neutrophils (arrowhead). Scale bar: 50 μm. Data are presented as the means ± SD. Abbreviation: Neu, neutrophil.
