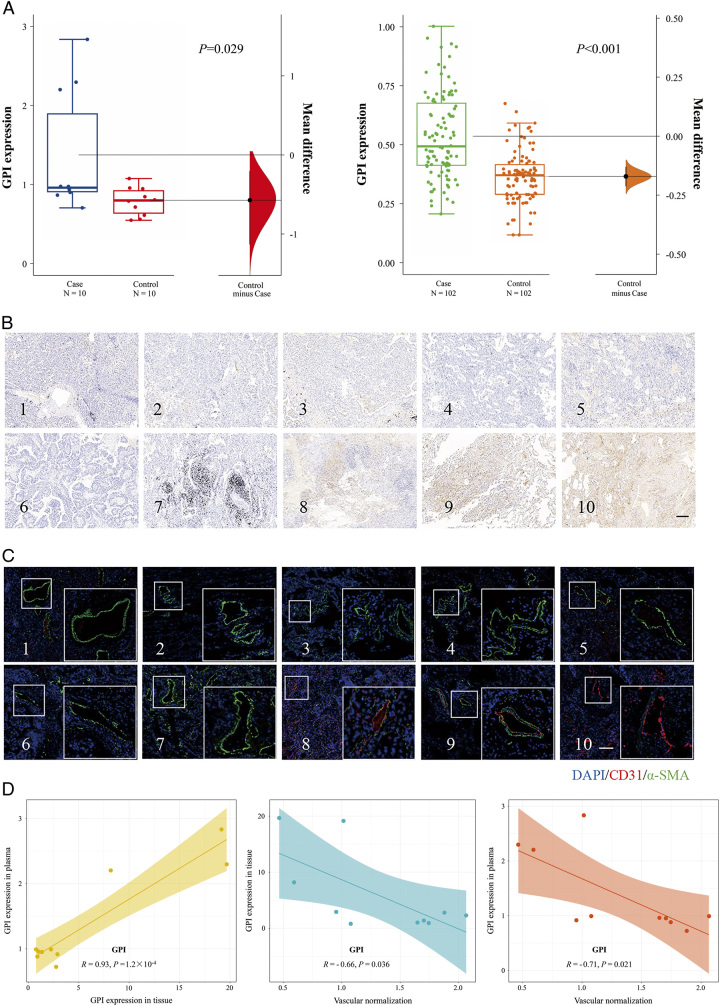
Figure 12.
Correlation between vascular normalization and GPI expression in LUAD plasma and tissues. (A) GPI expression in ‘Blood+’ screening and validation phases. (B) Immunochemical staining results of GPI in tumor tissues. Scale: 200 µM. (C) Immunofluorescence photographs of LUAD tumor tissue with CD31 and α-SMA staining. Scale: 200 µM. (D) Correlation analysis between the GPI expression in tumor tissues and plasma; Correlation analysis between the GPI expression in tumor tissues and vascular normalization; Correlation analysis between the GPI expression in plasma and vascular normalization.

