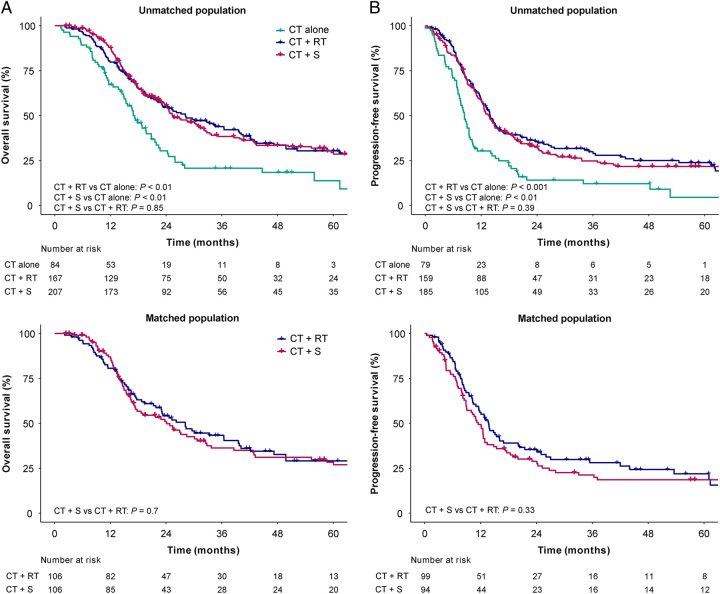
Figure 2.
Kaplan–Meier survival curves of different treatment modes in LS-SCEC. (A) OS of CT alone, CT+RT, and CT+S groups in unmatched population; (B) PFS of CT alone, CT+RT, and CT+S groups in unmatched population; (C) OS of CT+RT and CT+S groups in matched population; (D) PFS of CT+RT and CT+S groups in matched population. CT, chemotherapy; CT+RT, chemotherapy plus radiotherapy; CT+S, chemotherapy plus surgery; LS-SCEC, limited-stage small cell esophageal carcinoma; OS, overall survival; PFS, progression-free survival.

