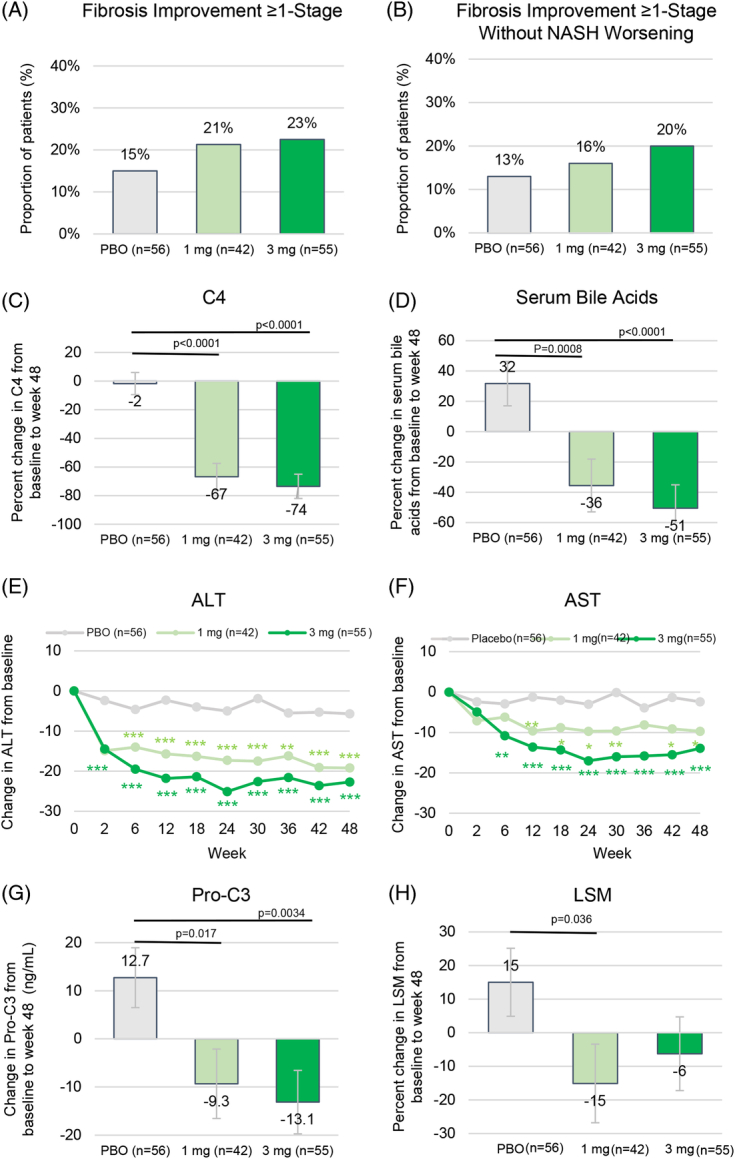
FIGURE 3.

Secondary end points. (A) Proportion of patients achieving fibrosis improvement of ≥ 1 stage at week 48. (B) Proportion of patients achieving fibrosis improvement of ≥ 1 stage with no worsening of NASH at week 48. (C) Change in serum C4 from baseline to week 48. (D) Change in serum TBA from baseline to week 48. (E) Change from baseline in ALT over time. (F) Change from baseline in AST over time. (G) Change in Pro-C3 from baseline to week 48. (H) Change in LSM from baseline to week 48. Shown are LS mean (SE). Fibrosis improvement of ≥ 1 stage was defined by NASH CRN criteria. No worsening of NASH was defined as no increase in NAS score for steatosis, no increase in ballooning, and no increase in inflammation. *p<0.05, **p<0.01, ***p<0.001 vs. placebo. Abbreviations: ALT, alanine aminotransferase; AST, aspartate aminotransferase; C4, 7alpha-hydroxy-4-cholesten-3-one; LS, least-squares; LSM, liver stiffness measure; NAS, NAFLD activity score; NASH CRN, NASH clinical research network; PBO, placebo; Pro-C3, neoepitope-specific N-terminal pro-peptide of type III collagen; TBA, total bile acids.
