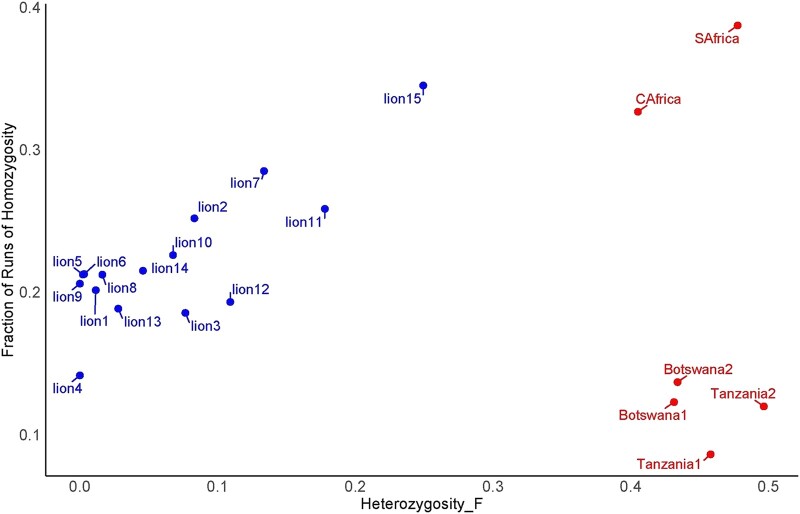
Fig. 5.
Calculation of inbreeding levels in AA lion as well as supplemental lion populations. The scatterplot illustrates inbreeding measurements based on heterozygosity (Het_F) and FROH. The blue dots (Het_F < 0.3) represent individuals from the AA lion population, while the red dots (Het_F > 0.4) represent individuals from supplemental lion populations.

