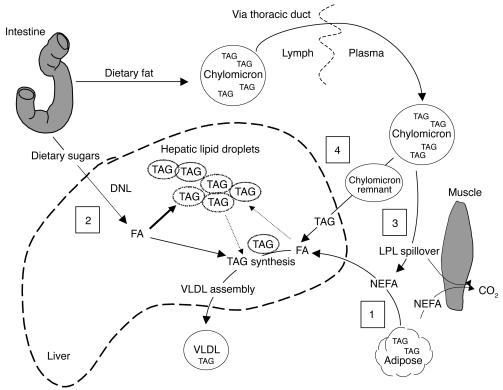
Figure 1.
Model of lipid flux through the liver. Boxed numbers indicate the metabolic pathways traced using stable (nonradioactive) isotopes. DNL indicates new fat synthesis from 2-carbon precursors (e.g., dietary carbohydrate); chylomicrons are lipoproteins made in the intestine that carry dietary fat. FA, cellular fatty acids (fatty acids not esterified to glycerol but bound to a carrier protein); LPL, lipoprotein lipase.

