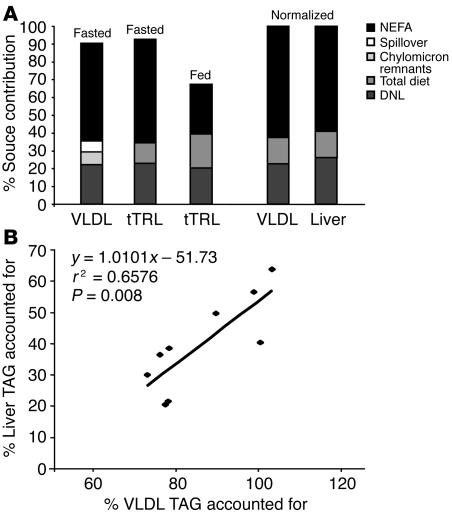
Figure 3.
Comparison of sources of TAG fatty acids in liver and lipoprotein fractions. (A and B) Sources of palmitate in VLDL, tTRL, and liver TAG accounted for after 5 days of labeling in subjects 1–9 (A), and the correlation between the percentage of TAG accounted for in the liver and VLDL (B). For both VLDL and tTRL, fasted-state values represent the average source contribution on day 5 at 0700 in subjects 1–9. Source contributions to tTRL TAG in the fed state were determined using the average values obtained on day 4 at 1500 in subjects 1–9. For comparison of liver TAG and VLDL TAG, fatty acid sources were normalized to 100%. Subject 3 has been omitted from this analysis due to undetectable concentrations of TAG in liver.

