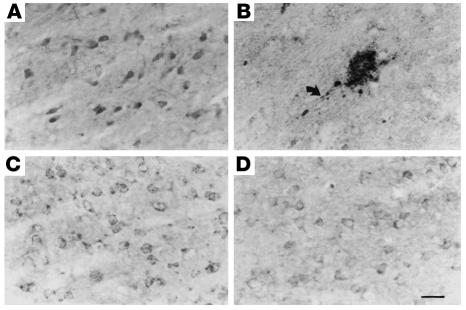
Figure 8.
Comparison of the immunocytochemical distributions of APP (A and B) and PS1 (C and D) in control (A and C) and thiamine-deficient (B and D) mouse brain. Note the accumulation of APP immunoreactivity in a dystrophic neuritic cluster during thiamine deficiency (B). Arrow shows APP accumulation in an abnormal neurite arising from the neuritic cluster. PS1-immunostained sections adjacent to A and B reveal no accumulation of PS1 immunoreactivity in abnormal structures during thiamine deficiency except in areas of severe cell loss, in which the immunostaining is pale (D). Scale bar: 25 μm. Figure reproduced with permission from American Journal of Pathology (50).

