Figure 6.
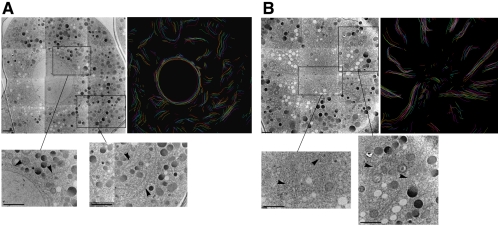
Ultrastructure of ER. These electron micrographs show the ultrastructural organization of the ER in the early embryo in either interphase (A) or prometaphase (B). For each set of images, the first image is a composite showing a section through the embryo, the second image is a tracing of multiple sequential sections, with each color representing a single section (see Materials and Methods for additional details), and each inset shows greater detail of the ER structure in either the central region (left inset) or in the more peripheral cytoplasm (right inset). The inset may be either from the same section as the shown composite or from another section in the same series. Arrowheads point to representative ER structures. Tracing in A consists of nine sections, and the tracing in B consists of 14 sections. Scale bar, 2 μm.

