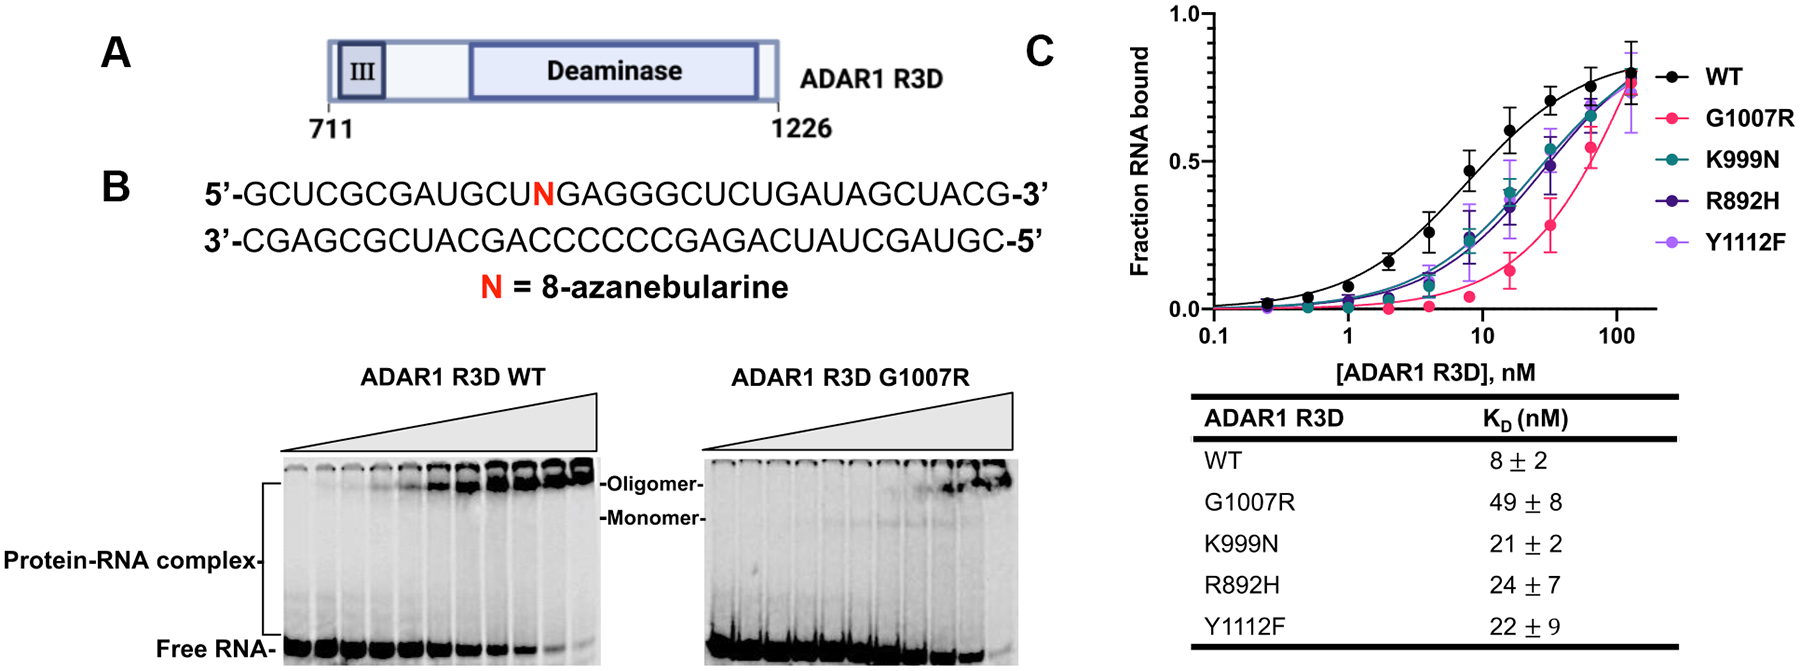
Figure 5.

Binding of AGS mutants of ADAR1 R3D to a 32 bp duplex bearing 8-azanebularine (N) analyzed by quantitative EMSA. (A) Domain map of ADAR1 R3D. (B) Sequence of 32 bp duplex bearing 8-azanebularine (N) and representative EMSA gels for ADAR1 R3D WT and AGS mutant G1007R. Reaction was performed at 1.1 nM 32 bp duplex and protein concentration was varied from 0 to 128 nM. (C) Quantitative analysis of the gel shift data. The binding data obtained from the gel shifts were plotted using the equation: y = A × [x/ (KD + x)], where y represents the fraction of RNA bound, x corresponds to the concentration of ADAR1 R3D, A denotes the binding endpoint, and KD represents the dissociation constant. The dissociation constant values were calculated from the plot and reported as the means of three technical replicates ± standard deviation.
