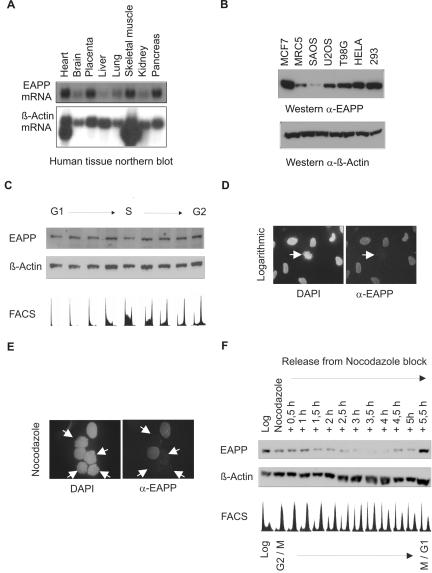
Figure 5.
Expression of EAPP. (A) Northern analysis of human tissues. A human mRNA tissue blot was probed first with radiolabeled human EAPP cDNA (top panel) and then reprobed with β-Actin cDNA (bottom panel). EAPP mRNA appears as a single band of ∼1.4 kB. (B) Western analyses of human cell lines. The top panel shows the amount of EAPP, and the bottom panel of β-actin. (C) Growing U2OS cells were elutriated and the fractions were examined by FACS, followed by SDS-PAGE, Western blotting, and immunostaining with the anti-EAPP antibody. The membrane was reprobed with anti-β-actin antibody to show equal loading. (D) Immunofluorescence of endogenous EAPP in growing cells. In the left picture interphase cells surround a mitotic cell with condensed DAPI-stained chromosomes. EAPP is not detectable in this cell (right picture). (E) Immunofluorescence of endogenous EAPP in cells arrested for 18 h with nocodazole. The arrows indicate cells with already condensed chromosomes. (F) U2OS cells were arrested with nocodazole for 18 h and then released for 5.5 hours. Every 30 min extracts from released cells were prepared and examined by SDS-PAGE, Western blotting, and immunostaining with the anti-EAPP antibody. The membrane was reprobed with anti-β-actin antibody to show equal loading. FACS analysis of each fraction was carried out in parallel (bottom panel).

