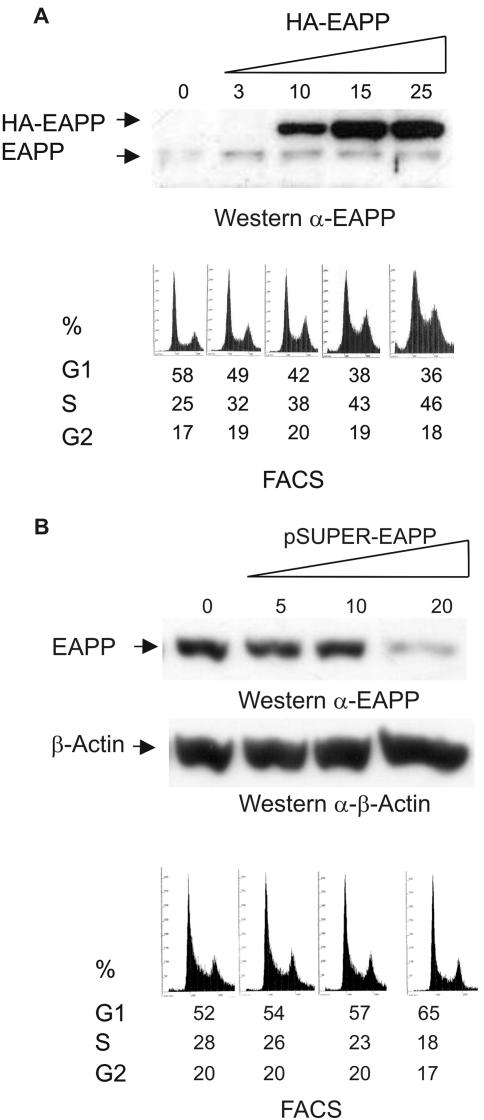
Figure 7.
EAPP overexpression and knock down in U2OS cells. Cells were transfected with either the empty vector or increasing amounts of an expression vector for either HA-EAPP (A) or EAPP siRNA (B). Forty-eight hours after transfection the cells were harvested and analyzed. The top panels are immunoblots showing endogenous and ectopic amounts of EAPP and β-Actin. The numbers refer to the amount of HA-EAPP or EAPP siRNA expression vector in μg used for the respective transfection. The bottom panels are FACS analysis showing the fractions of cells in G1-, S-, and G2-phase of the cell cycle.

