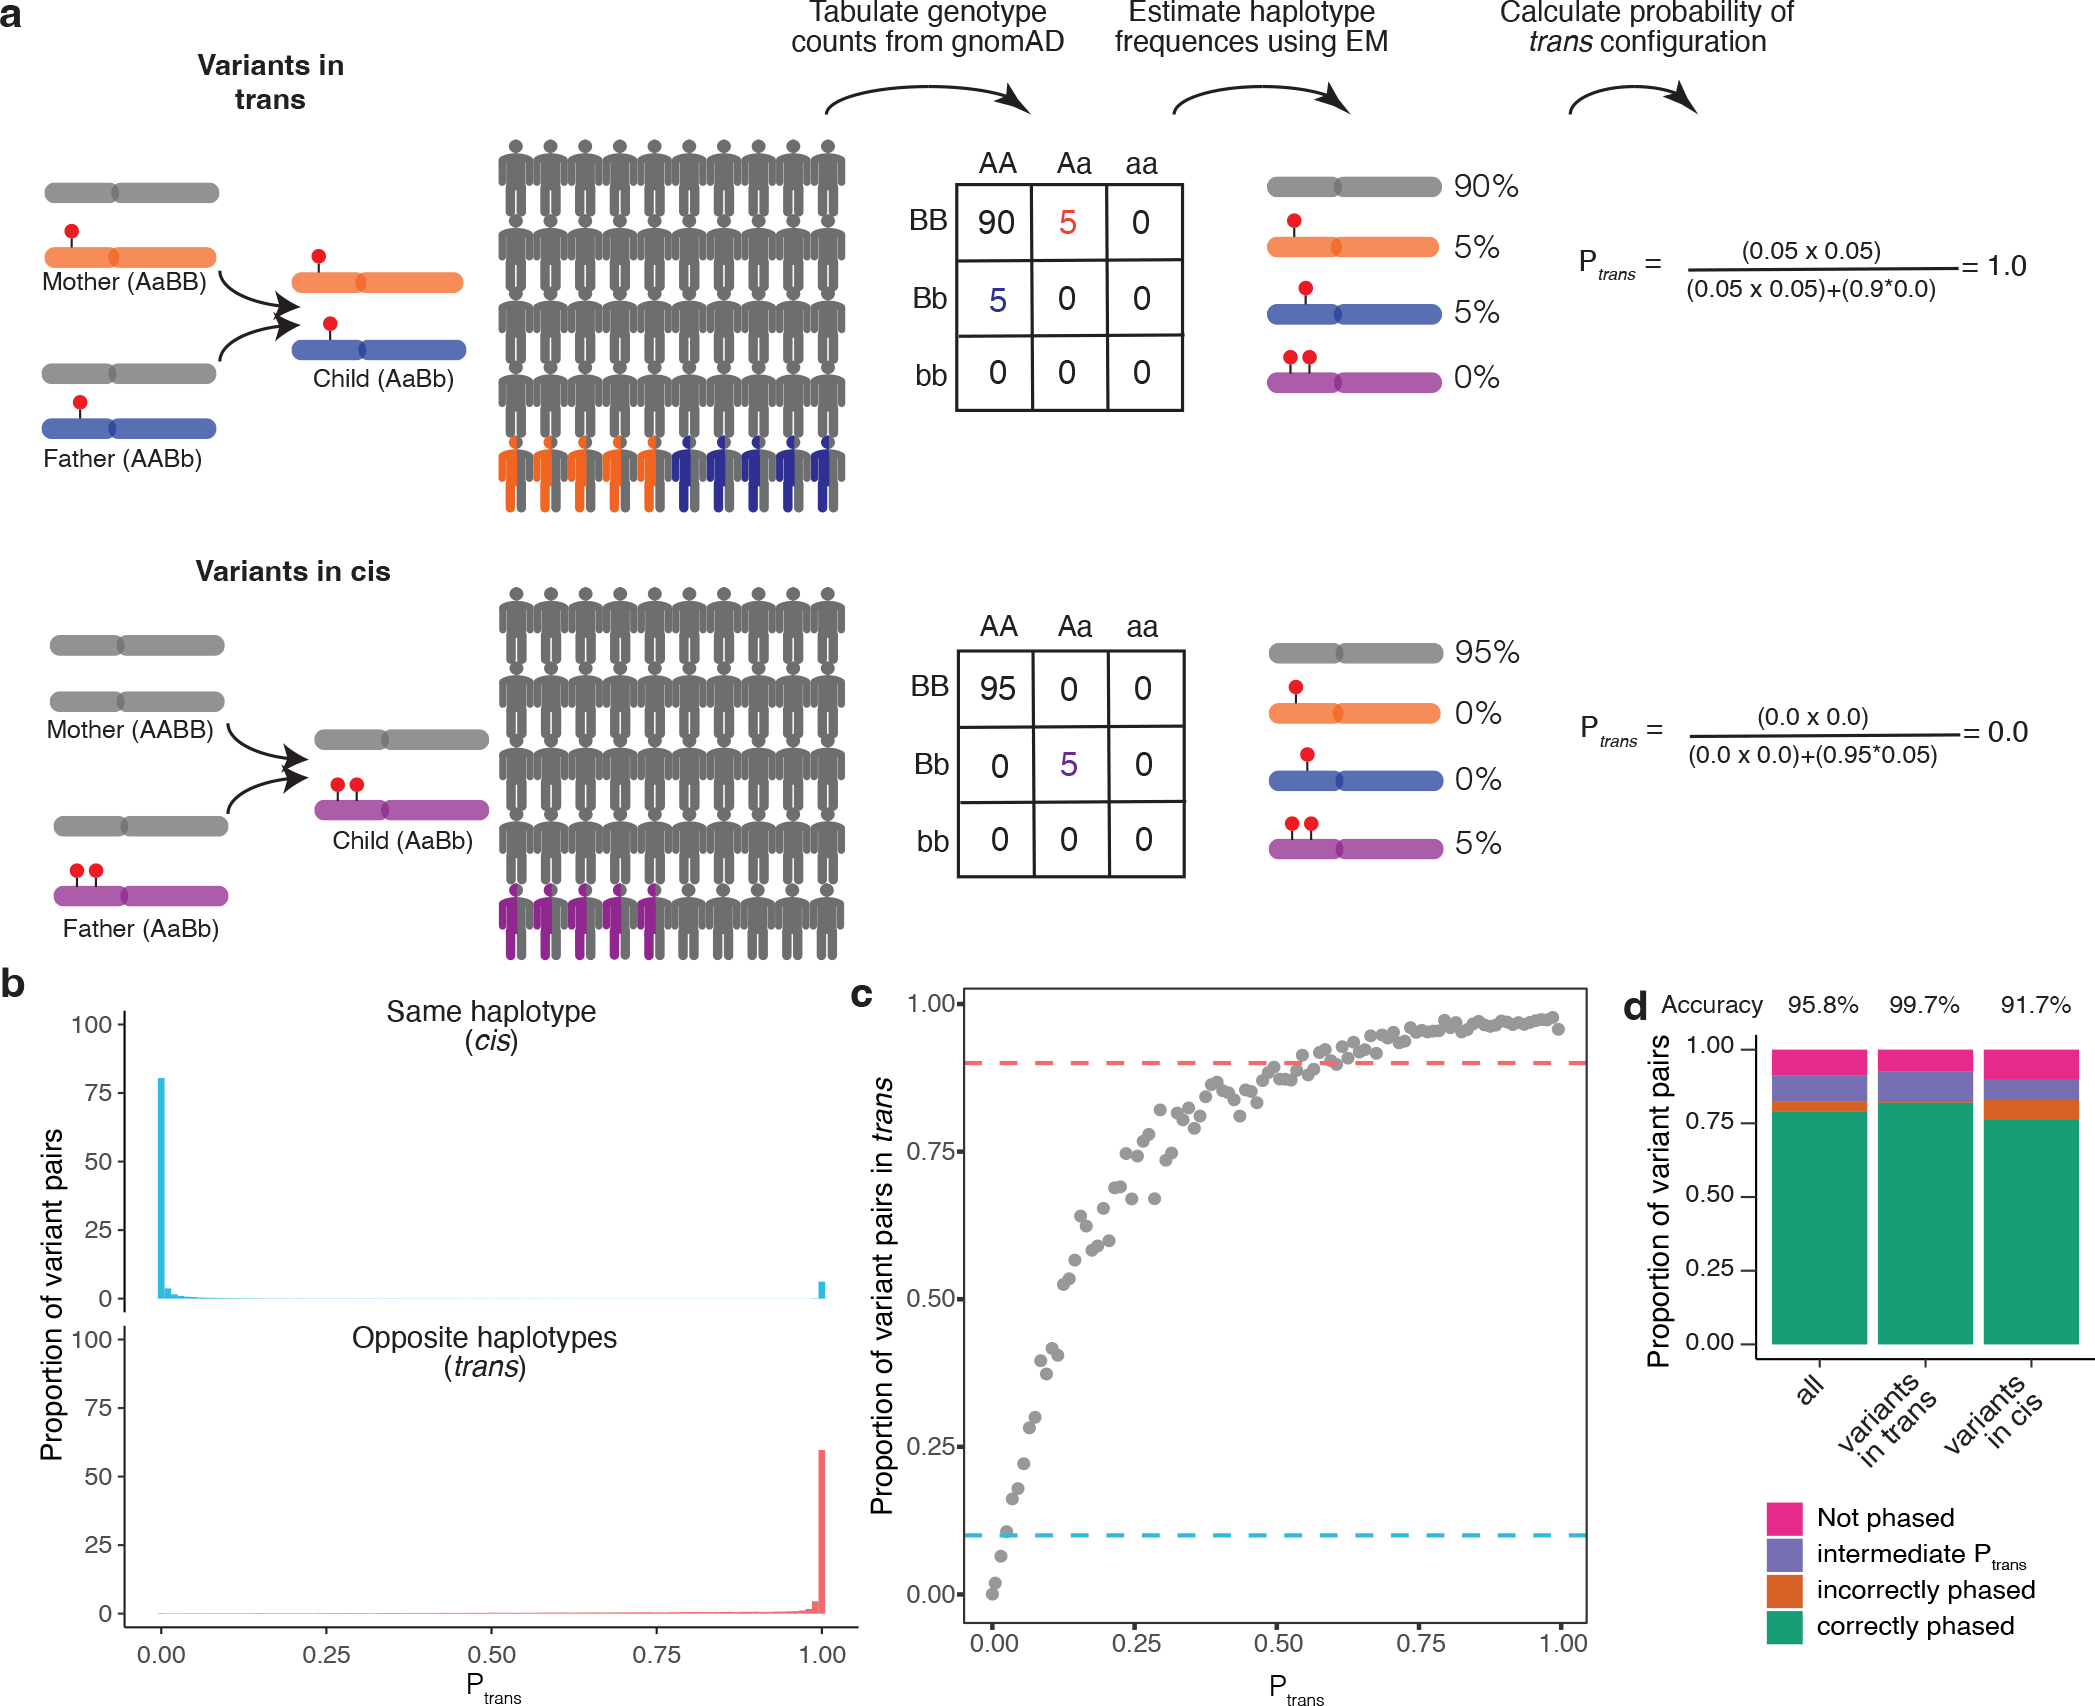
Fig. 1: Overview of phasing approach using Expectation-Maximization method in gnomAD.

a, Schematic of phasing approach. b, Histogram of scores for variant pairs in cis (top, blue) and in trans (bottom, red). c, Proportion of variant pairs in each bin that are in trans. Each point represents variant pairs with bin size of 0.01. Blue dashed line at 10% indicates the threshold at which ≥ 90% of variant pairs in bin are on the same haplotype (). Red dashed line at 90% indicates the threshold at which ≥ 90% of variant pairs in bin are on opposite haplotypes (). Calculations are performed using variant pairs with population AF ≥ 1×10⁻⁴. d, Performance of for distinguishing variant pairs in cis and trans. Accuracy is calculated as the proportion of variant pairs correctly phased (green bars) divided by the proportion of variant pairs phased using (orange plus green bars). b-d, scores are population-specific.
