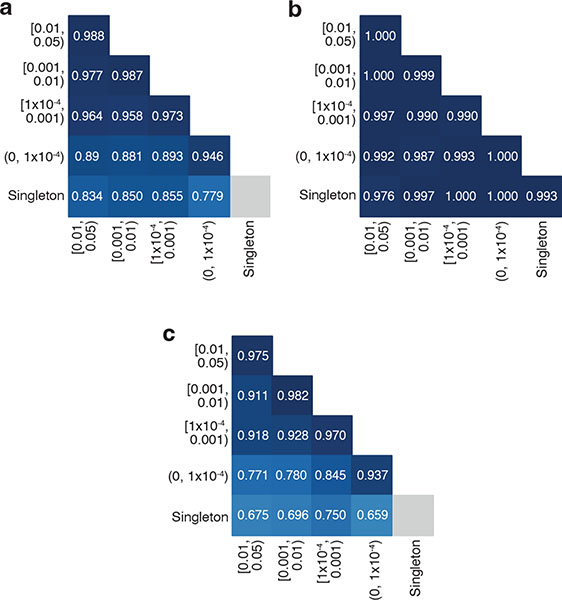
Fig. 2: Phasing accuracy as a function of variant allele frequency (AF).
Phasing accuracy at different AF bins for all variant pairs (a), variant pairs in trans (b), and variant pairs in cis (c). Shading of squares and numbers in each square represent the phasing accuracy. Y-axis labels refer to the more frequent variant in each variant pair and X-axis labels refer to the rarer variant in each variant pair. Accuracy is the proportion of correct classifications (i.e., correct classifications / all classifications) and is calculated for all unique variant pairs seen in the trio data across all genetic ancestry groups using population-specific calculations.

