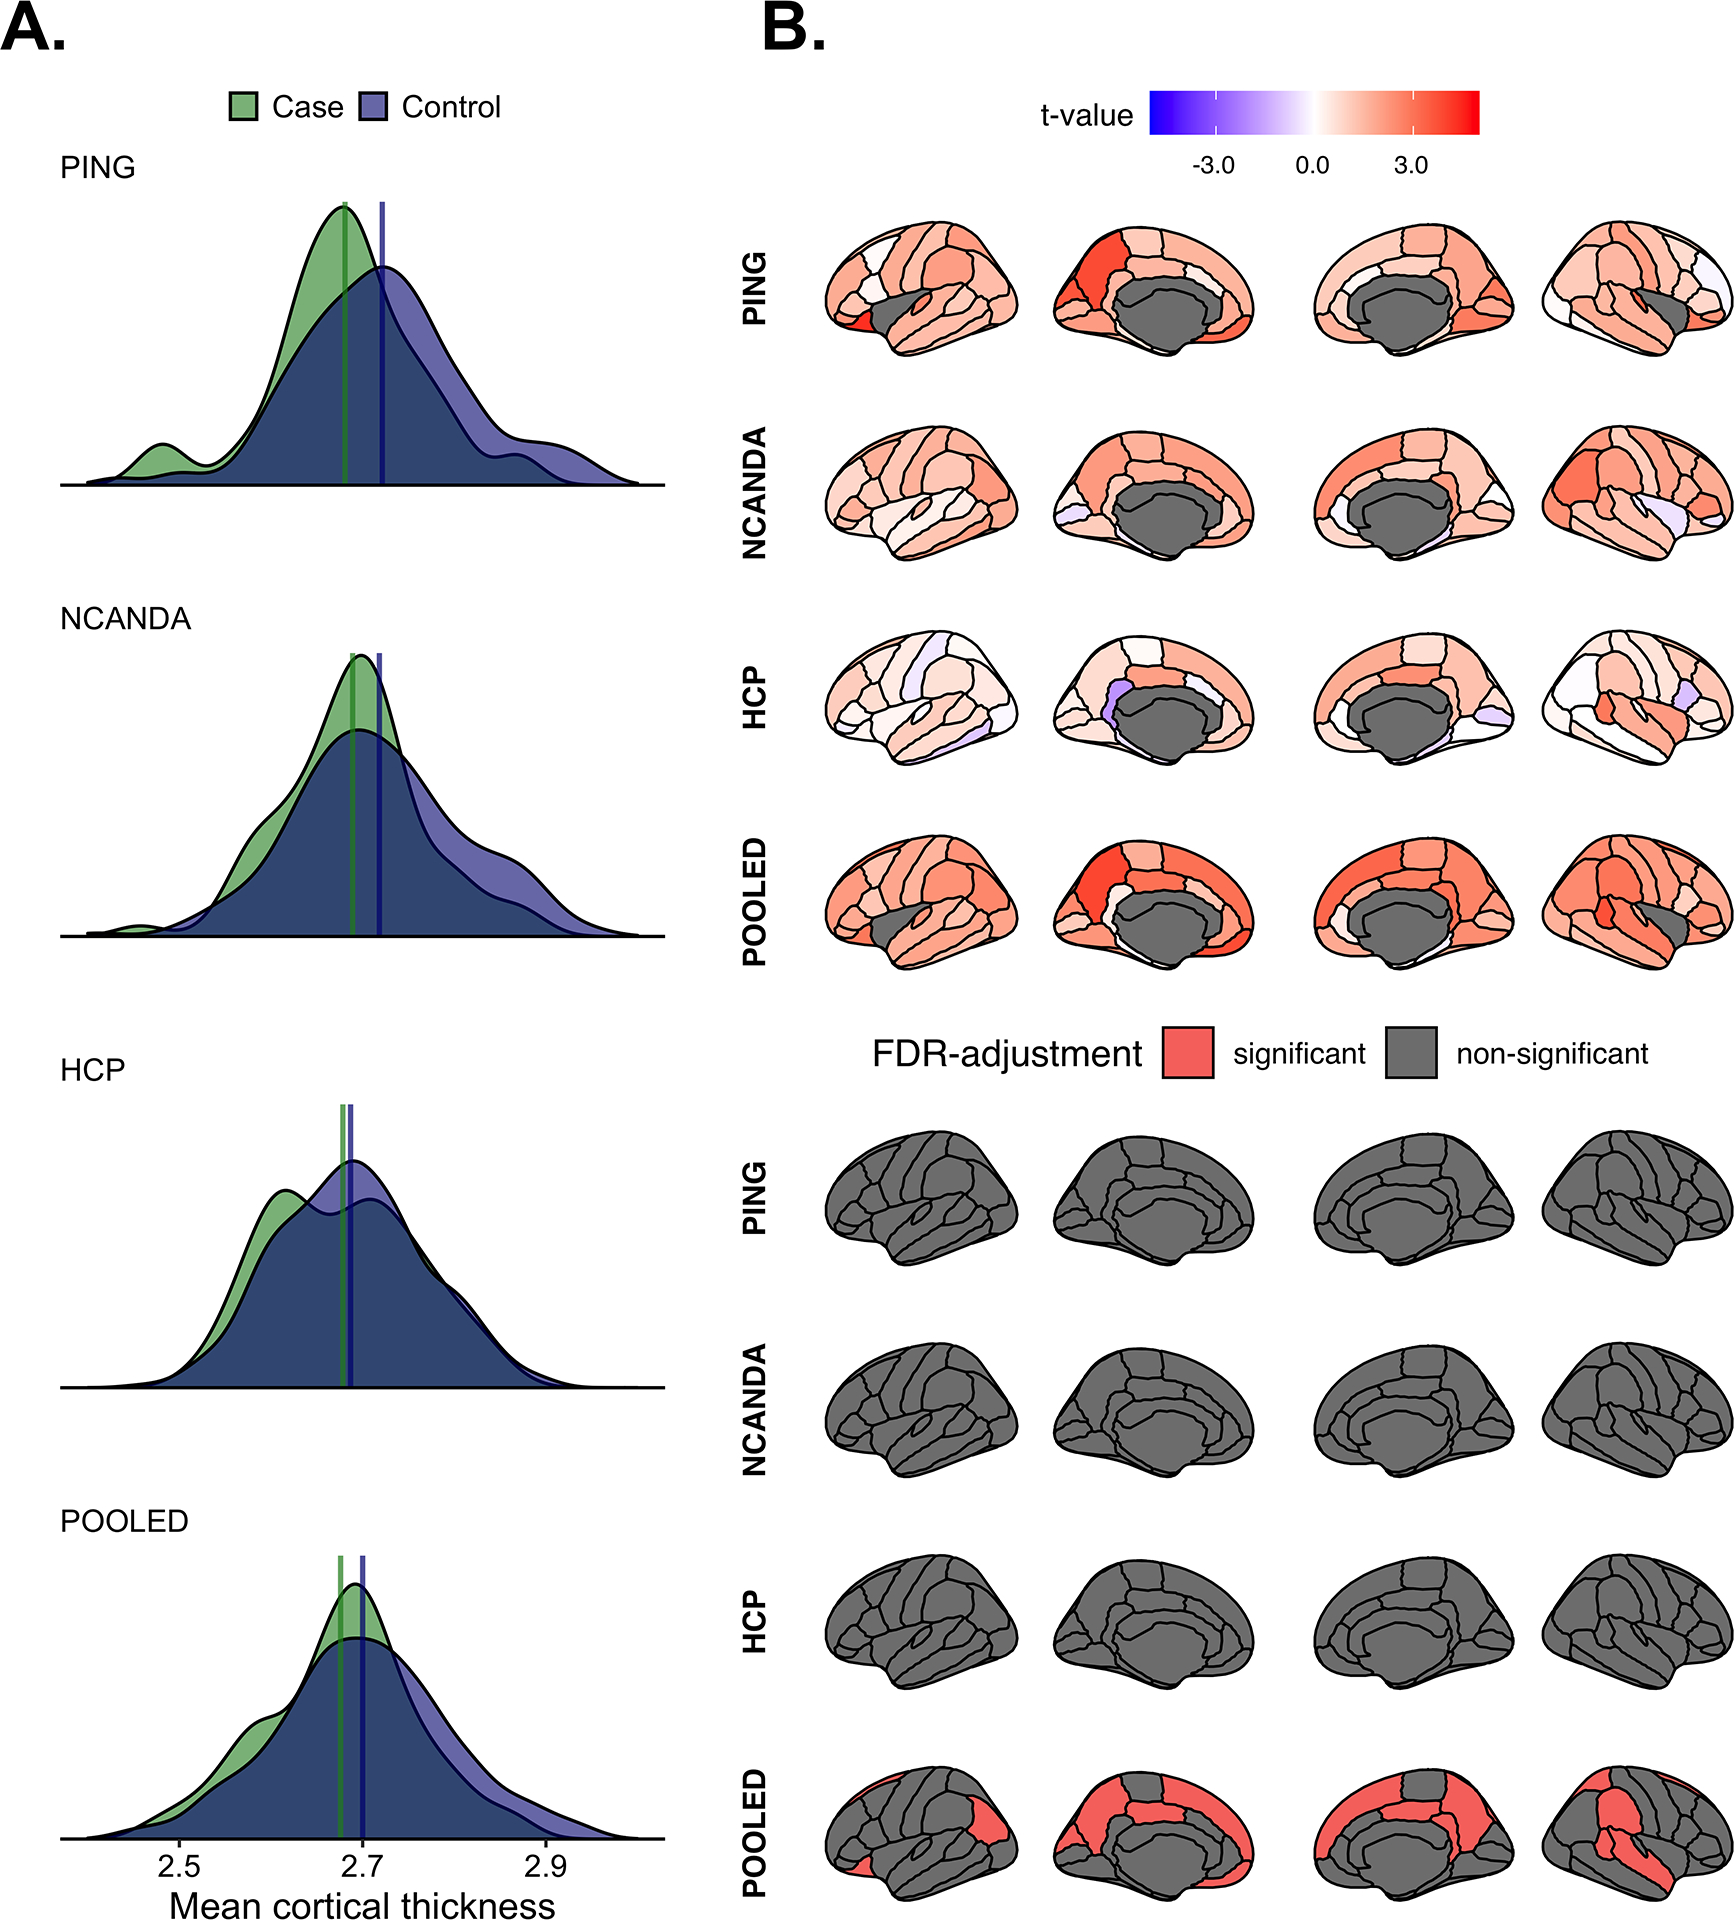
FIGURE 2.

(a) The distributions of mean cortical thickness per group and study. The upper portion of (b) shows the between-group differences in regional cortical thickness. Positive t-values indicate greater thickness in controls. Bottom portion of (b) shows regions surviving study-wise false discovery rate (FDR)-correction.
