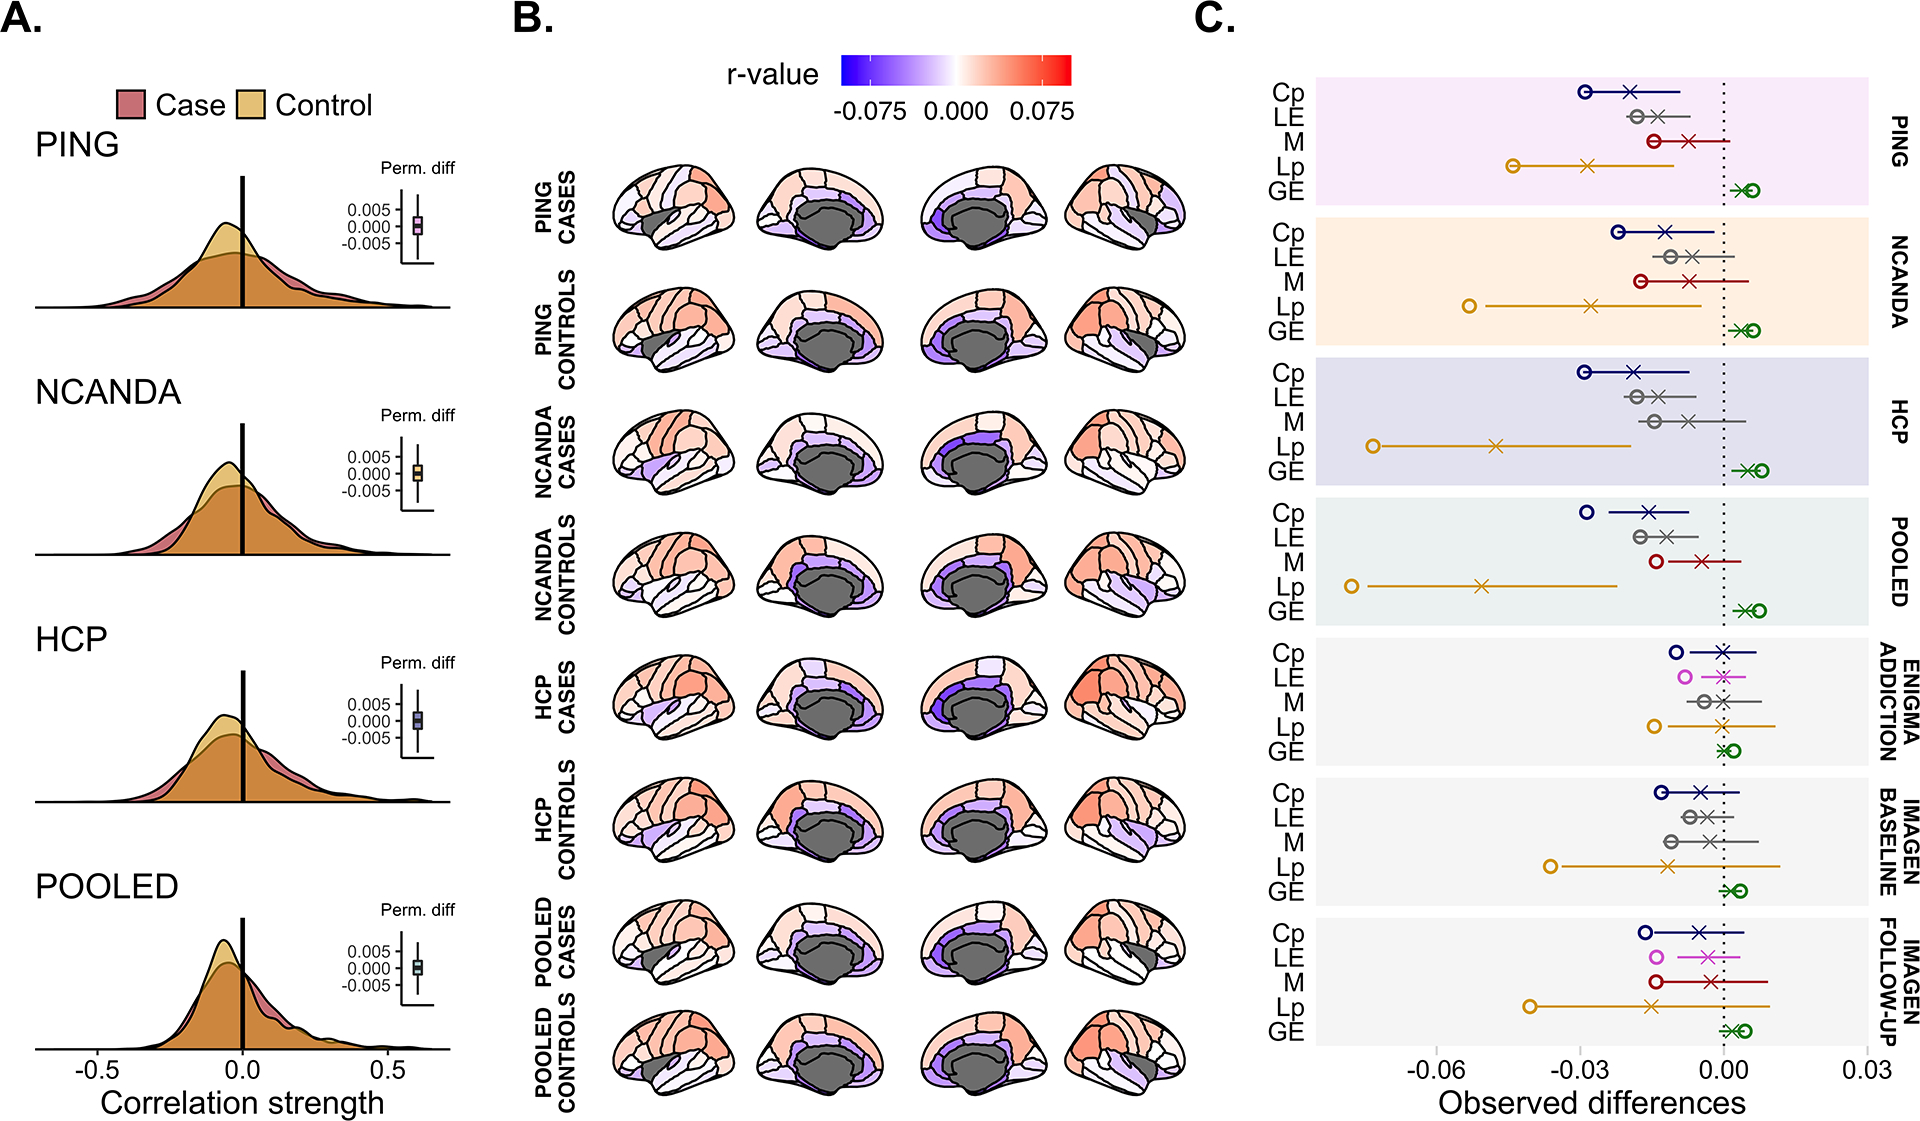
FIGURE 3.

(a) Overlap in the global correlation strength between groups. The vertical black line indicates the observed difference and the right-sided box-plot the permuted difference. No significant group differences were observed. (b) The average correlation strength per region-of-interest (ROI) and shows the similarity in regional correlation weights across both groups and studies. (c) Summary of the network-level metrics of the current study together with the summary statistics of our previous work. The horizontal line denotes the null distribution, the X the mean permuted difference under the null hypothesis and the circle the observed difference. If colored, the area under the curve (AUC) difference was significant (P < 0.05), otherwise the data are presented in grey. Cp = clustering coefficient; LE = local efficiency; M = modularity; Lp = average shortest path length; GE = global efficiency.
