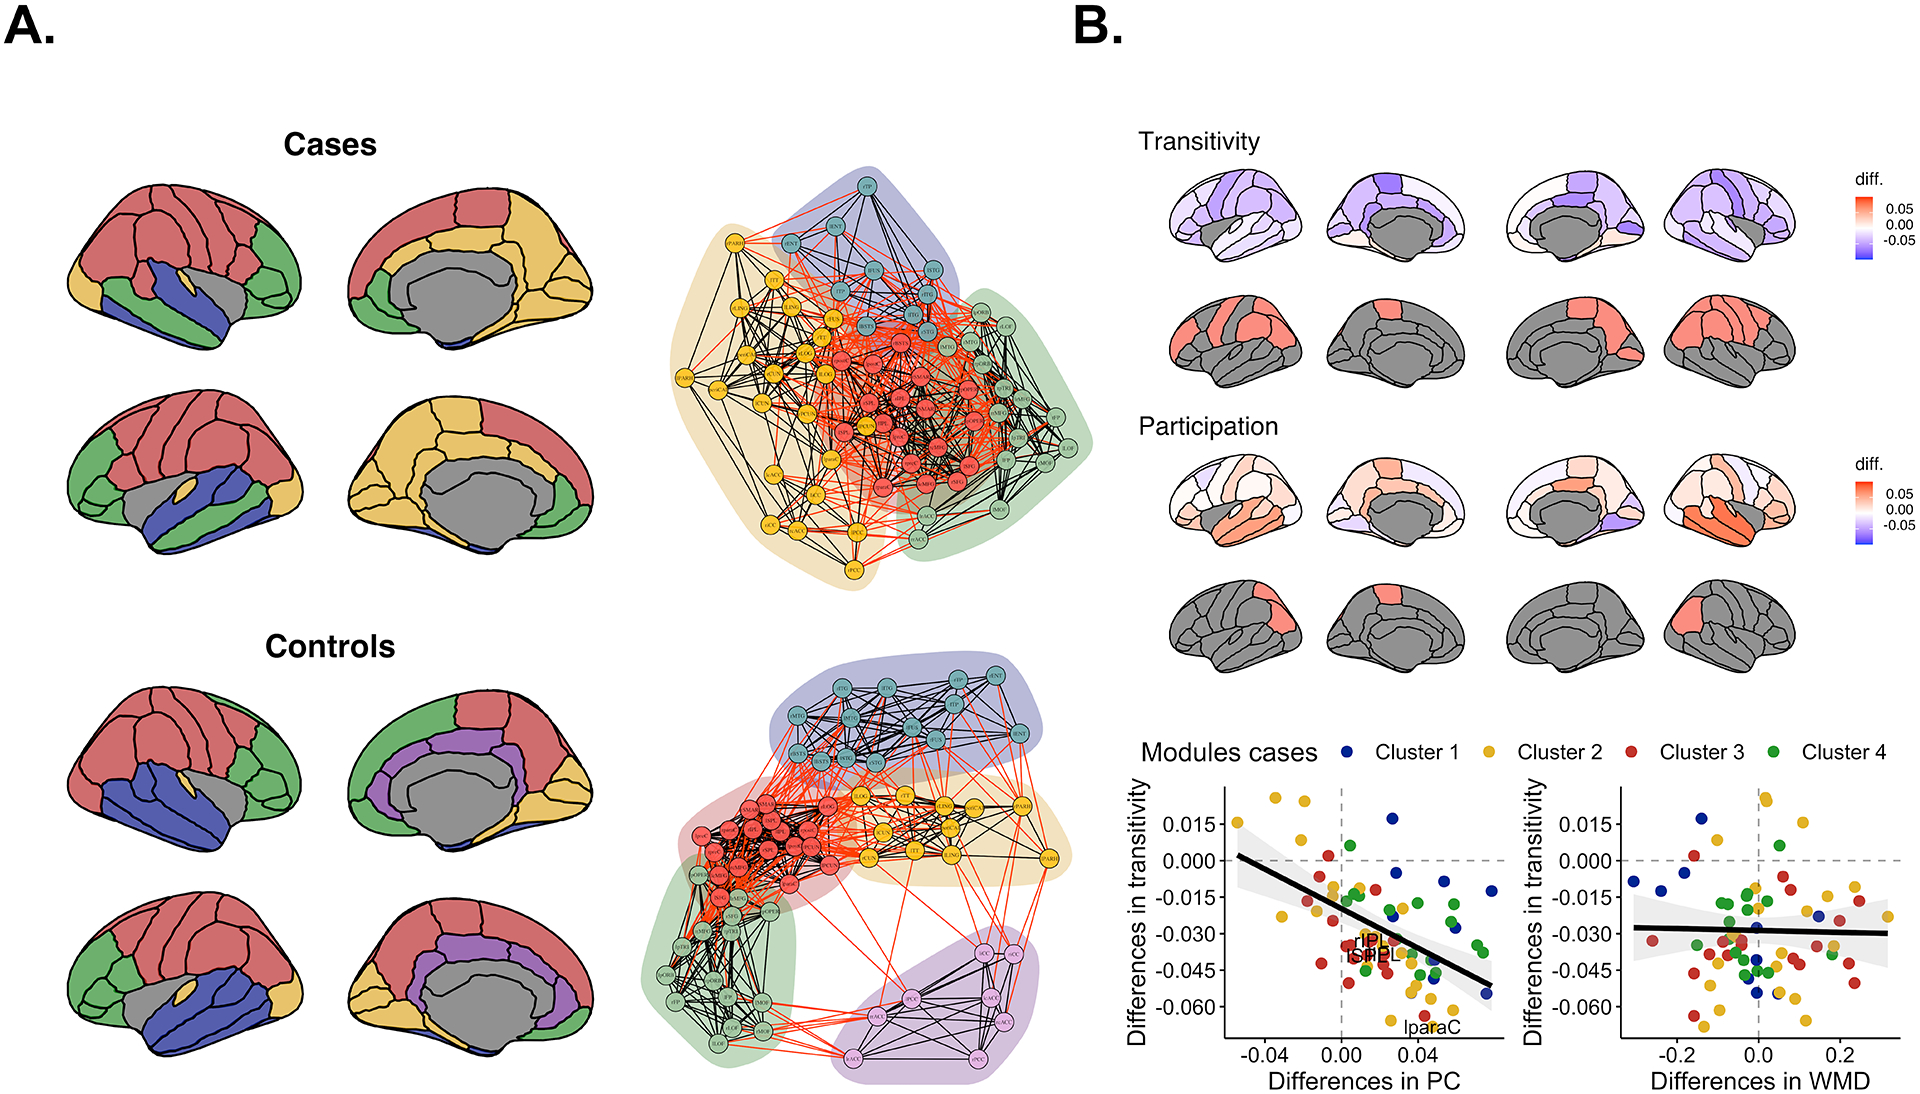
FIGURE 4.

(a) The different modules for cases and controls at their maximum density (30%). Red edges indicate intermodular correlations and black edges intramodular correlations. Greater overlap of modules represents more intermodule thickness similarities. (b) The upper row shows the unthresholded differences in transitivity and the second row shows nodes passing statistically significant cut-offs (P < 0.05). Blue indicates lower transitivity in cases. The middle row shows the unthresholded differences in the participation coefficient and below it the nodes passing cut-offs for statistical significance (P < 0.05). Red represents higher participation coefficient (PC) in cases. Bottom row depicts the correlation between the unthresholded differences in transitivity, PC and within-modular degree (WMD). Points are colored based on the modular organization of cases.
