
Figure 9. Treatment with lasmiditan (L) modules mitochondrial quality controls.
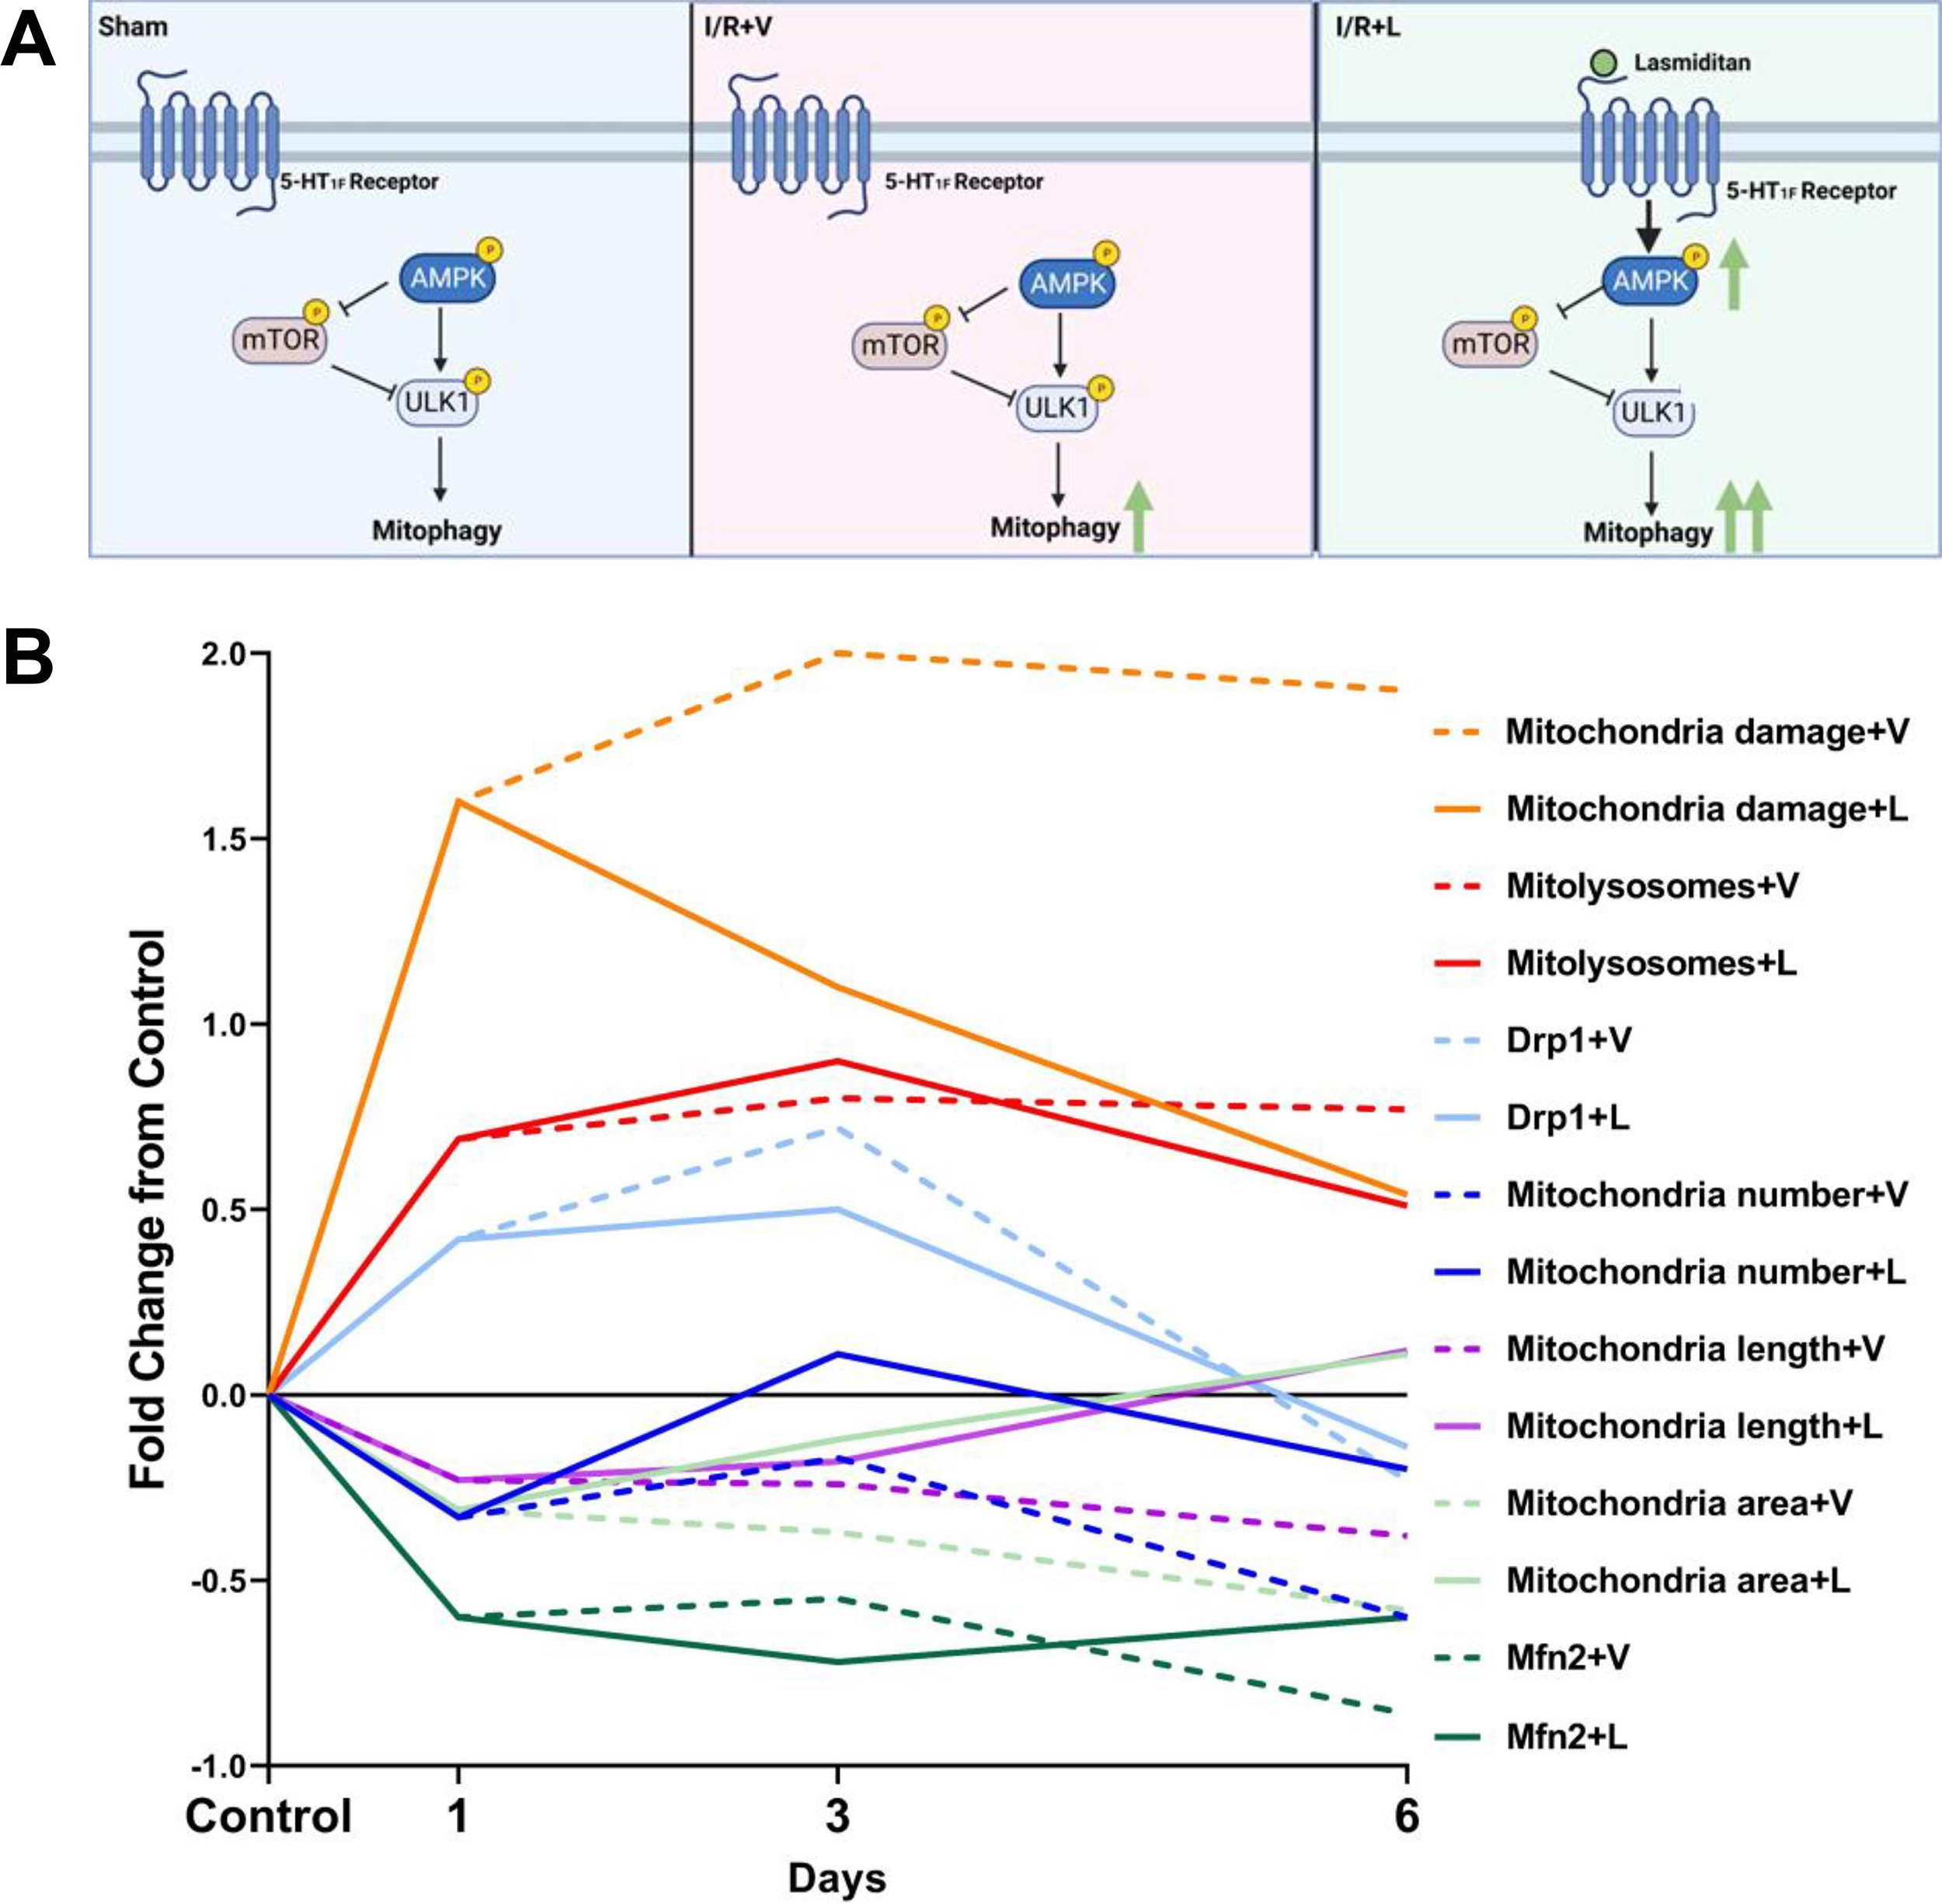
(A) Signaling pathway representation of regulation of mitophagy. (B) Analysis of fold change of mitochondrial makers after I/R injury compared to sham group. Solid lines represent lasmiditan treated group and dash lines represent vehicle group.