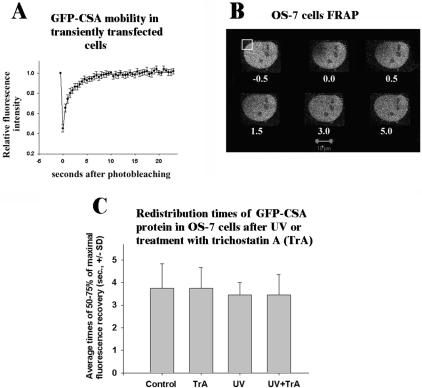
Figure 5.
FRAP assay of mobility of GFP-CSA in transiently transfected V79 (A) or stably expressing OS-7 cells (B and C). Vertical bars in A show SE; numbers in B show seconds after photobleaching. Bar (B), 10 μm; bleached segment is boxed. Redistribution times in C were calculated from the original FRAP curves as mean times for recovery of 50–75% of the maximal fluorescence recovery ± SD. Trichostatin A (TrA; 300 nM) was added for 24 h, UV-dose was 34 J/m2 followed by 1-h incubation in growth medium.

