Figure 6.
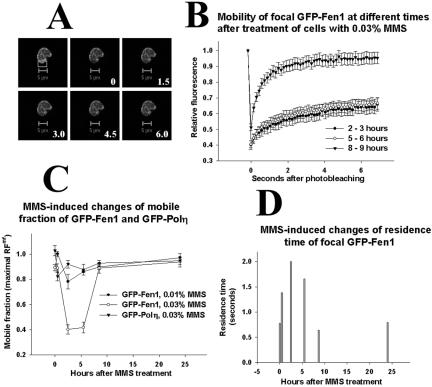
MMS-induced changes of mobility of GFP-Fen1 in stably expressing V79 cells. In A, bleached segment is boxed; bar is 5 μm, and numbers show seconds after bleaching. Vertical bars in B show SE of average values for 10–30 cells, results obtained at 2–3, 5–6, and 8–9 h after MMS treatment are combined. (C) Mobile fractions of GFP-Fen1 (circles) or GFP-Polη (triangles) at different times after MMS calculated as described in Materials and Methods. (D) Changes of residence time of GFP-Fen1 at replication foci after MMS, calculated as described in Materials and Methods.

