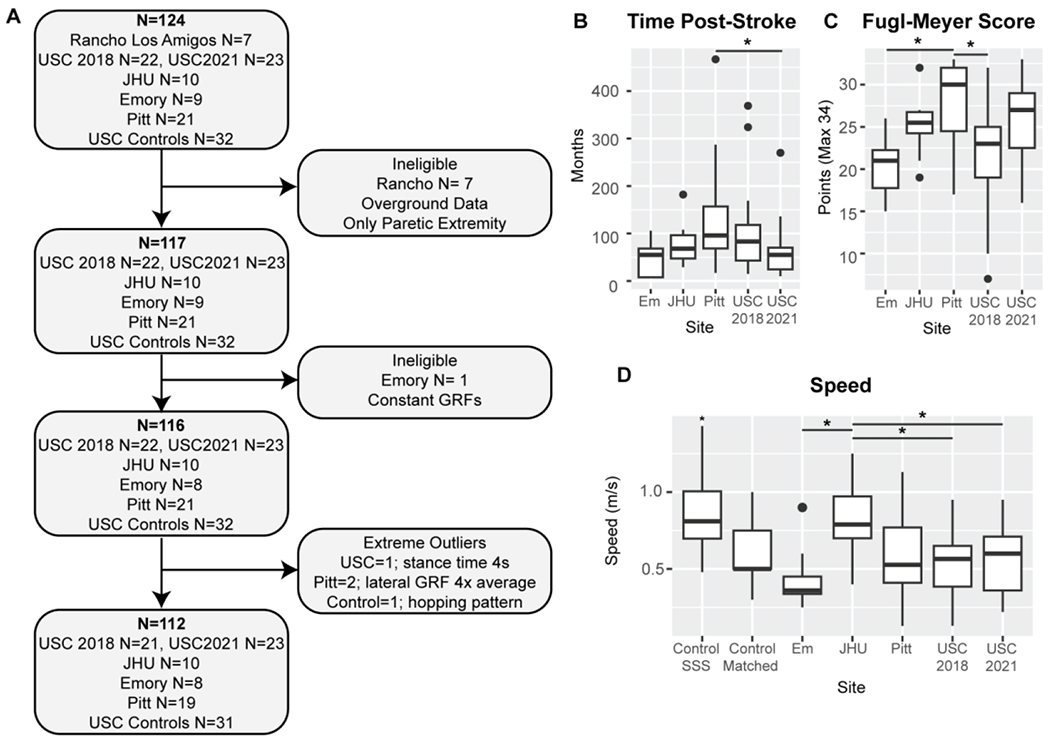
Figure 1. Data consolidation and quality assessments and demographics for the final sample.

A) Pipeline for participant inclusion. N indicates the sample size at each point for the total sample (bold) and the sample from each research site. The final sample size was N=112 participants. B) Time post-stroke onset in months across all research sites. Participants from Pitt were more chronic than those from USC2021 (p=0.033). C) Post-stroke participant lower extremity Fugl-Meyer score. The maximum score is 34 points. Participants from Pitt were less impaired than those from Em and USC. D) Treadmill self-selected walking speed for all participants. Control self-selected speed was significantly higher than the average speed in the stroke group (p<0.001). Control participants also walked at speed matched to that of a stroke participant of the same age and sex (Control Matched). Participants from JHU walked at a significantly greater speed than those from Em and both samples from USC (p<0.050).
