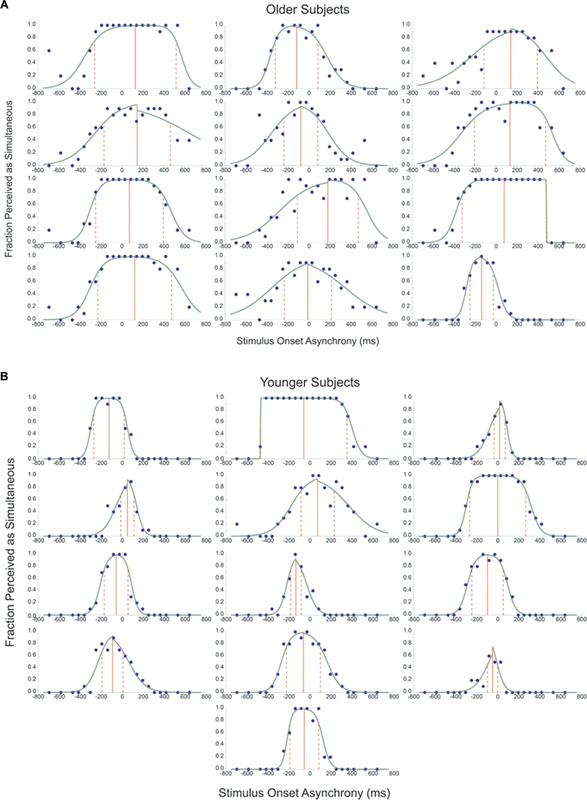
Figure 2.

Psychometric curves from older ( A ) and younger ( B ) subjects. The x -axis represents the stimulus onset asynchrony in milliseconds, and the y -axis represents the proportion of times the stimuli were perceived as simultaneous. The green lines represent the psychometric curves and the closed circles represent each subject's actual response. The temporal binding window is contained between the set of red dashed lines, with the solid red line representing the point of subjective simultaneity.
