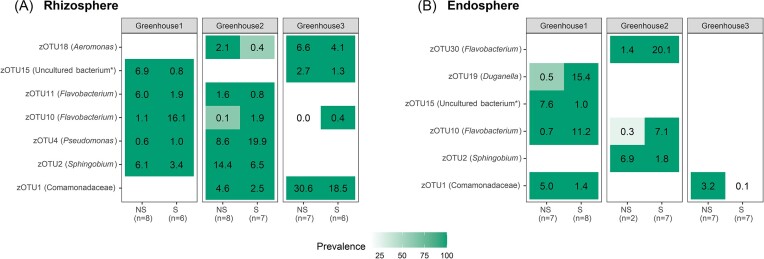
Figure 6.
Summary of the relative abundance and prevalence of the zOTUs, which are differentially abundant between nonsymptomatic (NS) and symptomatic (S) plants according to the combined results of the DESeq2, EdgeR, and LEfSe analyses and with an overall relative abundance of ≥ 5% for at least one greenhouse and symptomatic/nonsymptomatic plants. Results are presented for the three greenhouses separately for both the rhizosphere (A) and the endosphere (B). For each zOTU, the relative abundance is given as a number (%), while the color represents prevalence (i.e. fraction of samples in which the zOTU was present; white is absent). The number of replicates included is given between brackets. zOTUs are identified by a BLAST search against type materials in GenBank. When no significant similarity was found with type materials (< 97%), the BLAST analysis was performed against the entire GenBank (indicated with an asterisk). Identifications were performed at genus level; when identical scores were obtained for different genera, identifications were performed at family level.

