

Abstract
Research networks encourage team science and facilitate collaboration within and across research teams. While many analyses have examined the output of these collaborative networks (e.g., authorship networks, publications, grant applications), less attention has been paid to the formative phases of these initiatives. This article presents analyses of a whole-network survey of investigators participating in a new research initiative, and examines the development of collaborative ties over the network’s first year. In particular, we examine the influence of research center affiliation, seniority, and prior network experience on the number and structure of collaborative ties, including participants’ bridging and broker roles. Such analyses can inform the overall management of the project in purposefully promoting new collaboration opportunities, and may ultimately predict the number of collaborative products generated by the network members.
Keywords: research network, team science, collaboration, social network analysis
1. Introduction
Bridging the gaps between research and practice, and across diverse practice sectors, requires multidisciplinary collaboration. Research networks offer infrastructure, resources, and performance expectations that can foster collaboration within and across scientific teams. While collaborative ties and productivity can be readily measured through bibliometric data or other objective output from a mature network (Fonseca et al., 2016; Newman, 2004), these are likely influenced in part by professional relationships that predated the network, or by the infrastructure of the network itself. Comparatively few studies have examined collaborative ties in the formative years of a network in order to understand how and where such ties are formed, or where strategic interventions are needed to generate new collaborations. Success in these developmental stages sets the stage for participants’ subsequent productivity, and the collective impact of the network on practice.
The Clinical and Translational Science Award (CTSA) program (IOM, 2013), funded by the National Institutes of Health (NIH), embraced social network analysis (SNA) as a means to evaluate the success of its novel transdisciplinary network structure on promoting team science and ultimately accelerating the translation of research from bench to bedside. Published CTSA analyses have examined both network structure and productivity. For example, analysts have examined the role of disciplinary affiliation on collaboration (Dhand et al., 2016) and how this association changed over time (Luke et al., 2015); the influence of network participation on collaboration within and between participating institutions (Nagarajan et al., 2015) and its broader influence on the science conducted in the host institutions beyond the CTSA program (Bian et al., 2014); and scientometric analyses of the quantity and thematic content of scientific publications generated by the program (Zhang et al., 2014). Indeed, because the CTSA program invested in the use of SNA to evaluate its impact not only on clinical practice but on the research process itself, they have made substantial contributions to the methodology and application of SNA in this context (Bian et al., 2014).
Outside of the CTSAs, network analyses have also been used to evaluate the formation and evolution of other large government-funded research programs. For example, the evaluation of an implementation science training program used SNA to document the formation of new mentoring relationships and future collaborations on publications and grant applications (Luke et al., 2016). The Translational Cancer Research Network has applied SNA to identify early brokers and key actors within the network (Long et al., 2013); measure the influence of network participation on collaborative clusters and silos (Long et al., 2014); and examine increases in subsequent collaborations beyond the network (Long et al., 2016). More recently, the Implementation Science Centers for Cancer Control (ISC3) program utilized SNA to conduct a baseline analysis of its network structure and to identify areas of members’ shared expertise (Jacob et al., 2022). However, such analyses from existing research networks have not explored the structural and functional role of key network positions, such as those who are in bridging or broker roles that can facilitate research collaboration with a new network.
Identifying those who are best able to connect across groups of otherwise disconnected individuals, or “bridging actors,” for example, may be another efficient way to use structural network information to accelerate change (Burt, 2005). Bridging actors may be more efficient diffusion agents than centrally located ones because they have fewer interconnected alters to persuade (Holme and Ghoshal, 2009); they can devote more energy to collaboration and hence be more effective change agents. Additionally, bridging actors may be more receptive to innovative collaborations as they have less pressure to support prevailing norms and behaviors (Cancian, 1979) or incur a reputation cost for new and potentially controversial research (Burt, 2010). Finally, occupying a bridging position may be indicative of attitudinal dispositions like being open to new ideas and practices (Laumann, 1973; Valente and Fujimoto, 2010). By virtue of their boundary spanning positions, bridging actors often have early access to novel information, but are also experienced in communicating the information across diverse audiences (Burt, 2010). Moreover, while individuals in dense network structures often have an increased awareness of each other leading to greater informal control across members, bridging actors may have a greater likelihood of influence when innovative ideas and change are required (Fernandez and Gould, 1994; Burt, 2010).
This article follows on these examples to examine the baseline structure and early formation of collaborations within a new research network. Specifically, we describe the application of SNA to the initial year of a large multisite research cooperative funded by the National Institute on Drug Abuse (NIDA), part of the NIH, called the Justice Community Opioid Innovation Network (JCOIN). Like the CTSAs and other exemplar networks, JCOIN is inherently multidisciplinary and includes members that span institutions, geographic areas, and research/practice foci. In JCOIN’s first year, the network supported 11 research centers, plus an analytic center and a coordinating center. All of these components were connected by a common theme: conducting research on strategies to improve the delivery and quality of treatment services for opioid use disorder in the US criminal justice system (see Ducharme et al., 2021).
Each of the JCOIN research centers conducts an independent clinical trials, but a stated goal of the network is to generate results that are greater than the sum of the individual parts. The infrastructure of the network was set up to promote this goal, for example, using a core set of common measures to allow cross-site analyses; developing stakeholder boards to generate bi-directional feedback between the research and practice communities; and forming workgroups to promote collaboration on topics of shared interest while the clinical trials are underway. The formative year of a new network provides an intriguing opportunity to document pre-existing collaborative ties, and to identify key brokers within the network, and their early influence on the development of new professional connections. Understanding – and potentially influencing – the formation of these new ties may shape the nature, quantity, and impact of the network’s future output, and illuminate how cross-team collaboration influences clinical practice, organizational culture, and public policy.
This study employs social network analysis to examine the dynamics of a collaborative research network-in-formation. Grounded in the network concepts of brokerage and centrality, this study examines the different functions and roles of JCOIN researchers in forming collaborative ties over the network’s first year. We assess whether new ties and brokerage roles differ by the researcher’s status (principal investigators vs. other team members); center affiliation (research centers vs. coordinating/analytic centers); and prior experience in similar NIDA-funded criminal justice research networks.
Because these early ties will provide support for cross-network collaboration on analyses, publications and other products in subsequent years, this research can directly inform the overall management of the network, and may highlight areas where proactive intervention can help integrate outliers (isolates) and provide additional opportunities for collaboration.
2. Data and Methods
2.1. The Network Structure
JCOIN comprises 11 distinct research teams. The configuration of the network inherently promotes collaboration within the different research teams. Each funded research center was required to propose a multisite clinical trial involving partnerships with justice agencies and community-based addiction treatment service providers in at least five communities. At least one individual representing a partnering justice agency, and one individual representing a community-based service provider, were required to be named as co-investigators on the grant awards. As a result, the project teams are inherently multidisciplinary and bridge both research and practice. JCOIN’s analytic and coordinating centers are assigned a broad array of responsibilities that require multidisciplinary teams, services and technical support provided across the network, and robust stakeholder engagement.
Additional JCOIN infrastructure established post-award was intended to promote collaboration between research teams. The network’s Steering Committee includes all of the principal investigators and community partners, along with the NIDA science officer and an external chairperson. The Steering Committee sets network policies and procedures. More than a dozen workgroups conduct the work of the Steering Committee, from data sharing and publication policies to survey design and qualitative analysis. Each workgroup has representation from all of the research centers. An example of a collaborative workgroup activity in Year 1 was the development of a set of common data elements to be collected across all of the clinical trials to allow cross-center analyses in later years.
Two key elements of JCOIN’s network infrastructure are the analytic and coordinating centers, which were expected to have driven much of the initial collaboration activities in its first year. The analytic center works with each of the research centers to troubleshoot data problems and to facilitate data sharing. The analytic center also conducts original research, including surveys and simulation modeling, that supplement and complement the work of the research centers. The coordinating center provides logistical and communication support to the network, works with the research centers to disseminate emerging study results, and engages the research teams in providing training and technical assistance to the broader field, among other support.
In short, it was intended that the structure of the initiative would itself encourage a team science approach by promoting increased collaboration within and between the funded research centers, with the ultimate goal of generating research findings that are readily translatable for public health impact. However, while most studies of research networks focus on their output (e.g., publications, grant applications), these products take years to develop. By focusing on the initial year of a new research network, we hope to identify the key factors in the early development of new collaborative ties.
2.2. Data Collection
Shortly after JCOIN’s launch in September 2019, and again in the fall of 2020, an online social network survey was distributed to all individuals who were actively involved in some component of the initiative. This network boundary specification included all Steering Committee members, workgroup members, and research team members. Respondents to each survey wave utilized a common reference period. The baseline network survey (Wave 1), administered in early 2020, asked respondents to report on collaborative ties that pre-dated the network – i.e., that existed prior to September 2019. The follow-up social network survey (Wave 2) was administered in Fall 2020/Winter 2021, and asked respondents to report on their collaborative ties with other network members between September 2019 and August 2020 – i.e., the first full year of the network.
The self-administered survey was announced during several network meetings and presented to each eligible participant as a voluntary and confidential survey. The project was reviewed by the IRB at NORC at the University of Chicago, where it was deemed exempt. Informed consent was obtained from all participants at the start of each survey. There was no incentive provided for survey completion. The response rate for Wave 1 was 87% and the response rate for Wave 2 was 80%. Each respondent was assigned an identification number to allow linking of their ties across surveys. While there was some attrition of researchers who left the network after completing Wave 1, they were retained in these analyses if other network members identified collaborative ties with them at Wave 2.
A total of 132 individuals in research roles responded to the two surveys. Of these, seven respondents were excluded from the analyses because they were either not affiliated with one of the research centers (i.e., NIDA staff and Steering Committee chairperson), or were affiliated equally with multiple research centers. The final analytic sample includes 125 researchers.
2.3. Network Survey Measures
Surveys collected the following information:
Existence of a collaboration.
Respondents were provided a roster of active network members. They were asked to indicate whether they knew each person, and if so, whether they had any professional contact with them during the reference period.
Frequency and strength of collaboration.
Respondents indicated how frequently they were in contact with each known network member, and rated the strength of the collaboration (very weak to very strong).
Type of collaboration.
Respondents characterized the type of collaboration with each network member: starting new research together; submitting a grant application; publishing a paper, giving a presentation, or hosting a workshop together; and participating in steering committee workgroups together.
Role in the network.
Respondents indicated their role in their research center (e.g., Principal Investigator, project manager, research scientist, data analyst, trainee), their organizational affiliation (e.g., university), and research center affiliation. For analysis, individuals serving as Principal Investigator (PI), multiple PI or co-PI were coded as “investigators,” with all others coded as “other research team members.” Investigators tend to be the most senior researchers in each center. Analyses also differentiate between individuals affiliated with one of the 11 research centers, versus those affiliated with either the analytic or coordinating centers.
Prior involvement with specific NIDA research networks.
Some of the JCOIN participants had been involved in prior NIDA-funded criminal justice research networks. To assess whether past involvement in similar networks influenced respondents’ number and type of reported collaborations, we created a dichotomous variable to indicate whether respondents had participated on the research teams in either of the two most recent predecessor networks. These were the Juvenile Justice: Translational Research on Interventions for Adolescents in the Legal System (JJ-TRIALS) network, active from 2013–2019, and the Criminal Justice Drug Abuse Treatment Studies (CJ-DATS II) network, active from 2008–2014.
Demographics.
The surveys requested demographic information on each respondent, including race/ethnicity, gender identity, sexual orientation, and education.
2.4. Social Network Analysis
We generated directed collaboration network data by constructing a 125 × 125 adjacency matrix, , where the diagonal elements (self-loop) are coded as zero and off-diagonal element, , are coded as 1 if person names person as collaborator, and coded as 0 otherwise. Note that this matrix is asymmetric by nature as naming does not imply that will reciprocate the nomination back to .
We computed the percentage of newly realized ties between Wave 1 and Wave 2 (defined as ) and Jaccard similarity index as a measure for tie stability (defined as ) (Snijders, van de Bunt, & Steglich, 2010) (See Table 2). The primary attributes analyzed are: (1) principal investigator (PI) status, and (2) prior history in the predecessor networks.
Table 2:
Transition table showing changes in collaboration ties from Wave 1 (baseline) to Wave 2
| Wave 2 | % of Newly Realized Ties | Jaccard Coef. | |||
|---|---|---|---|---|---|
| Non-Ties | Ties | ||||
| Wave 1 | Non-Ties | (Null) | (Formed) | ||
| Ties | (Dissolved) | (Maintained) | |||
| Between Researchers from the same center | Wave 2 | % of Newly Realized Ties | Jaccard Coef. | ||
| Non-Ties | Ties | ||||
| Wave 1 | Non-Ties | 423 | 190 | 30.995*** | 0.669*** |
| Ties | 60 | 505 | |||
| Between Researchers from different centers | Wave 2 | % of Newly Realized Ties | Jaccard Coef. | ||
| Non-Ties | Ties | ||||
| Wave 1 | Non-Ties | 13062 | 371 | 2.762 | 0.634*** |
| Ties | 90 | 799 | |||
| Between PI & PI | Wave 2 | % of Newly Realized Ties | Jaccard Coef. | ||
| Non-Ties | Ties | ||||
| Wave 1 | Non-Ties | 794 | 147 | 15.622 | 0.612*** |
| Ties | 34 | 285 | |||
| Between Non-PI & Non-PI | Wave 2 | % of Newly Realized Ties | Jaccard Coef. | ||
| Non-Ties | Ties | ||||
| Wave 1 | Non-Ties | 7252 | 166 | 2.238 | 0.647*** |
| Ties | 39 | 375 | |||
| Between PI & Non-PI | Wave 2 | % of Newly Realized Ties | Jaccard Coef. | ||
| Non-Ties | Ties | ||||
| Wave 1 | Non-Ties | 5439 | 248 | 4.361 | 0.665*** |
| Ties | 77 | 644 | |||
Percentage of newly realized ties was calculated as N01/(N00 + N01)
Jaccard similarity index as a measure for tie stability between two consecutive waves was calculated by N11/(N01 + N10 + N11).
p < 0.001;
p < 0.01;
p < 0.05;
p< 0.10. Permutation test, controlling for network density and covariate distribution, was used to assess statistical significance.
Brokerage Roles.
Gould and Fernandez’s (1989) typology of brokerage roles was applied to the network members. Researchers were partitioned into 13 distinct subgroups according to their affiliation with the research/analytic/coordinating centers. Five types of brokerage relations that involve one intermediary person were specified, and corresponding brokerage roles of coordinator, itinerant broker, gatekeeper, representative, and liaison were assigned based on how each actor bridged various collaboration ties (illustrated in Figure 1).
Figure 1: Brokerage Roles.
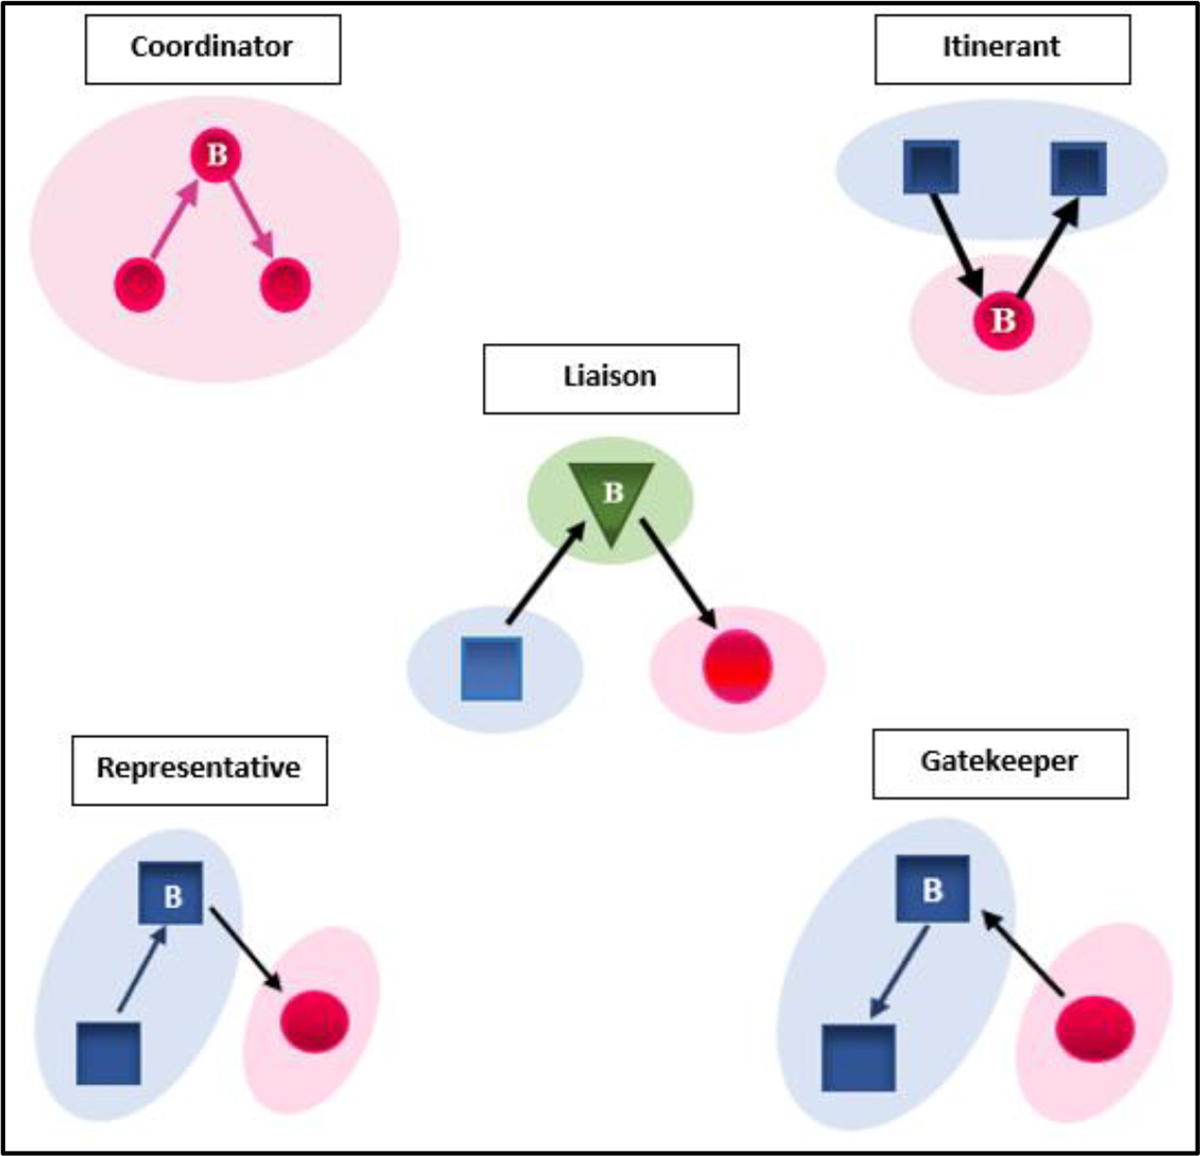
Note: Shown are five types of brokerage relations that were constructed for these analyses by partitioning respondents by their affiliations with research centers (i.e., non-overlapping subgroups). In the examples shown, Individual B is the broker of interest, and each color represents a different research hub and the broker’s relationship to them. Adapted from Gould & Fernandez (1989, p. 93).
An individual functioning in a coordinator role promotes within-team collaboration by connecting two researchers internal to their own center. Other roles contribute to cross-team collaboration. In the case of itinerant brokers, the intermediary connects two researchers external to the broker’s center. In a gatekeeper role, the intermediary connects an outside collaboration-seeking researcher to a researcher within the broker’s own center. In a representative role, the intermediary represents his or her entire center in seeking collaboration with a researcher of a different center. In a liaison role, the intermediary connects one collaboration-seeking researcher outside the intermediary’s center to another individual in a third center. Scores on these measures reflect the number of times an individual researcher served in that brokerage role. In addition, we computed network measures for a sociometric-based brokerage score (Everett & Valente, 2016). This brokerage measure is formulated to distinguish brokerage from degree centrality by characterizing brokerage as having high betweenness scores, but also penalizing high degrees that may require more resources to maintain each tie that is directly connected to others.
Centrality.
Measures of three dimensions of centrality were computed: degree (potential for communication activity), betweenness (potential for control of communication), and closeness (potential for either efficiency or independence of others) (Freeman, 1979). A degree is measured separately for outdegrees (the number of collaborations sent) that measures the level of activity in seeking collaboration, and for indegrees (the number of collaborations received) that measures the level of popularity through being offered collaboration from others. Closeness measures the degree to which the researcher can reach or be reached by other researchers at the shortest path in the network. Betweenness measures the degree to which the researcher falls on the shortest paths between other pairs of researchers, serving as an intermediary to connect to other researchers. The concept of central positions is distinct from that of brokerage roles, as the former are concerned more with overall connectivity, while the latter are concerned with subgroup divisions (here, center affiliations) in considering structural positions.
Statistical test for the increase in network measures between two waves.
All network measures were calculated for both waves, stratified by investigator status, prior history in one of the predecessor networks, and affiliation with the coordinating/analytic centers. In addition, we computed the change in network measure from Wave 1 to Wave 2. A permutation test was used to test whether the observed difference was larger than the expected (i.e., right-sided test). The permutation procedure (1) simulates a Wave 1 and Wave 2 network, while controlling for both density of the networks and distribution of actor attributes; (2) computes the network measure of interest using the simulated network from Step (1) as inputs; (3) repeats this process 10,000 times; and (4) tests the hypothesis and draws inference by comparing the observed network’s statistics to the simulated networks’ statistics.
A byproduct of controlling for network density is that we are able to take into account the general increase in number of collaborations from Wave 1 to Wave 2. The null hypothesis of the permutation test is that the observed statistic is no larger than what we expect, given the controlled factors. Thus, a rejection of the null hypothesis implies that, given there is some expected general increase in number of collaborations over time, our observed network measure is even larger than what was expected. All computations and statistical assessment were conducted using the R package “sna” v2.6, “network” v1.17.1, and “igraph” v1.2.9.
3. Results
3.1. Descriptive Statistics of Study Sample
As seen in Table 1, 74% of the respondents had either a doctorate or medical degree, and 29% served in a principal investigator role on a JCOIN-funded grant. About three-quarters of the study participants are based in one of the 11 research centers, with the remainder affiliated with the analytic/coordinating centers. About 25% of the participants had prior experience in one of the predecessor research networks. Network members are predominantly white and female.
Table 1:
Baseline demographics for N=125 researchers included in analysis
| Characteristics | Freq. (%) |
|---|---|
|
| |
| Gender | |
| Female | 53 (42.4) |
| Male | 43 (34.4) |
| Other | 1 (0.8) |
| Not reported | 28 (22.4) |
| Race | |
| White | 82 (65.6) |
| Black/African American | 4 (3.2) |
| Asian | 7 (5.6) |
| Other | 1 (0.8) |
| Multi-race | 1 (0.8) |
| Not reported | 30 (24.0) |
| Education | |
| BS/BA | 6 (4.8) |
| MS/MA/MPH | 24 (19.2) |
| PhD/MD/PsyD/JD/DrPh | 93 (74.4) |
| Other | 1 (0.8) |
| Not reported | 1 (0.8) |
| Prior History in Predecessor Networks | |
| No prior network experience | 93 (74.4) |
| Experienced in predecessor network(s) | 32 (25.6) |
| Role | |
| Investigator role (PI/MPI/Co-PI) | 36 (28.8) |
| Other research team members (Non-PI) | 89 (71.2) |
| Center Affiliations | |
| Coordinating & Analytic Centers | 30 (24.0) |
| Research Centers | 95 (76.0) |
3.2. Changes in Collaboration Ties
Table 2 provides a transition table that represents changes in collaboration ties from Wave 1 (the network’s baseline) to Wave 2. At Wave 1, respondents reported on collaborations in the year prior to JCOIN’s formation.
At Wave 1, the 125 respondents named a total of 1,454 existing collaborations, and the network density was 9.4%. Among all collaboration ties at baseline, 565 (38.9%) were between researchers from the same center, and 889 (61.1%) were between researchers from different centers. There were 1,178 possible collaborations between researchers affiliated with the same center, and 565 (48.0%) were realized. Conversely, there were 14,322 possible collaborations between researchers from different centers, and 889 (6.2%) were realized.
By Wave 2, the total number of named collaborations within the network increased from 1,454 to 1,865 and consequently the network density was increased to 12.0%. Among Wave 2 ties, 695 out of a possible 1,178 ties (59.0%) among researchers from the same center were realized, and 1,170 out of a possible 14,322 ties (8.2%) were realized between researchers from different centers.
In terms of change over time, at Wave 1 there were a total of 14,046 non-ties, hence this was the number of possible new ties that could have been formed from Wave 1 to Wave 2. Researchers within the same center formed 190 out of a possible 613 ties (31.0%), while researchers from different centers formed only 371 of a possible 13,433 new ties (2.8%) at Wave 2.
The test of network stability through Jaccard’s coefficients shows what we would expect from a typical collaboration network (i.e., relatively large Jaccard’s coefficient). The estimated Jaccard’s coefficients are 0.67 for the within-center networks, 0.63 for the cross-center networks, 0.61 for the network amongst principal investigators, 0.65 amongst other research team members (non-PI), and 0.67 for the network between PI and non-PI members; all p<0.001. This shows that while there are some changes within the collaboration network from Wave 1 to Wave 2, the changes are small enough that the network can still be considered as stable.
Using a latent space random graph model (Hoff, Raftery and Handcock, 2002), we plotted the first-year changes in the network’s collaborative structure in visual form in Figure 2. Such models are especially useful in that they provide a visual representation of a social network in which the distance between nodes (individuals) is meaningful; these models are well suited for networks whose members are clustered, as is the case here (research center affiliation). The figure depicts an overall increase in collaborative ties. Clustering by color of the nodes (research centers) implies that collaborations were stronger within-centers at Wave 1. By Wave 2, the network begins to fill in, and it is apparent that new networks have formed, in particular between research centers.
Figure 2: Visualization of JCOIN collaboration networks with individual research hubs.

In the graphs shown, each point is an individual network member; triangles are PI’s and circles are other research team members. Each research hub is represented by a different color. The collaboration network includes 124 nodes (number of researchers), 1,428 edges (number of collaborations) at wave 1, and 1,850 edges at wave 2. We estimated the node positions using a latent space random graph model (Hoff, Raftery and Handcock, 2002). Using purely the collaboration ties information, the model estimates node positions based on how likely a pair of nodes are connected – that is, how likely two researchers are to collaborate.
3.3. Descriptive Statistics for Network Measures
Table 3 presents cross-sectional network measures by prior network history and PI status.
Table 3:
Network statistics at Wave 1 (baseline) and Wave 2
| Network Statistics | Research Role within JCOIN | Experience in Predecessor Network | ||
|---|---|---|---|---|
|
| ||||
| Non-PI | PI | Prior Network Experience | No Prior Experience | |
|
| ||||
| Wave 1 (baseline) | ||||
| Brokerage roles | ||||
| Coordinator | 4.52 | 10.56 ** | 12.06 (23.83) | 4.26 (7.60) ** |
| Itinerant Broker | 0.94 | 5.06 (6.72) | 5.22 (7.83) | 1.06 (2.75) |
| Representative | 14.73 | 58.83 ** | 73.16 (00.75) | 11.70 (18.86) ** |
| Gatekeeper | 13.11 | 86.00 ** | 81.10 (107.21) | 11.60 (20.86) ** |
| Liaison | 23.22 | 157.17 ** | 185.12 (272.01) | 10.37 (48.00) ** |
|
| ||||
| Centrality | ||||
| Indegree (Ties | 8.44 | 19.53 ** | 21.94 (12.63) | 8.09 (6.15) ** |
| Outdegree (Ties Sent) | 8.97 | 18.22 ** | 22.12 (9.85) | 8.02 (6.36) ** |
| Betweenness | 0.01 | 0.03 (0.04) ** | 0.02 (0.04) | 0.01 (0.01) ** |
| Closeness | 0.37 | 0.44 (0.00) ** | 0.48 (0.04) | 0.36 (0.12) ** |
|
| ||||
| Wave 2 (year 1) | ||||
| Brokerage roles | ||||
| Coordinator | 4.82 | 9.00 ** | 8.03 (12.40) | 5.33 (9.75) ** |
| Itinerant Broker | 0.75 | 5.39 (6.96) | 4.84 (7.06) | 1.14 (2.97) |
| Representative | 26.31 | 86.47 ** | 91.78 (111.27) | 27.08 (48.19) ** |
| Gatekeeper | 21.04 | 96.25 ** | 101.72 (132.06) | 22.40 (41.12) ** |
| Liaison | 30.67 | 255.96 ** | 254.84 (403.01) | 40.75 (94.60) ** |
|
| ||||
| Centrality | ||||
| Indegree (Ties | 10.62 | 25.56 ** | 24.91 (14.02) | 11.48 (8.37) ** |
| OuMegree (Ties Sent) | 11.56 | 23.22** | 25.94 (13.21) | 11.13 (10.10) ** |
| Betweenness | 0.00 | 0.02 (0.02) ** | 0.02 (0.02) | 0.00 (0.01) ** |
| Closeness | 0.37 | 0.45 (0.19) * | 0.51 (0.10) | 0.36 (0.19) ** |
Note:
p<0.001;
p<0.01;
p<0.05;
p< 0.10; group-wise comparison tested using permutation test controlling for network density and covariate distributions. Betweenness Centrality scores are normalized. For Coordinator, Itinerant Broker, Representative, Gatekeeper, and Liaison the average frequencies are shown. Degree, Closeness, and Betweenness Centralities are continuous measures hence mean values are shown.
Descriptive Network Measures (Wave 1).
At baseline, principal investigators were responsible for larger proportions of both ties sent (p<0.001) and received (p<0.001) versus other network members. As seen in the Centrality measures in Table 3, each PI on average sent 18 ties and received 20 ties at Wave 1, whereas other research team members on average sent 9 ties and received 8. PI’s also had larger betweenness centrality scores (p<0.001). Overall, PI’s served more brokerage roles in their centers when compared to other research team members (p<0.01 for all brokerage roles except itinerant broker).
Similarly, members who had a prior history in one of the predecessor research networks sent and received significantly more ties at baseline compared to those without prior experience (p<0.001 for both ties sent and received). Those with prior history also had higher betweenness centrality than those without prior history (p<0.001). Individuals with prior network history were significantly more likely to serve in all brokerage roles except for itinerant broker.
Descriptive Network Measures (Wave 2).
Principal investigators continued to have higher network measures at Wave 2, sending and receiving significantly more ties than other researchers (p<0.001 for both ties sent and received, see Centrality scores in Table 3). PI’s on average also had higher betweenness centrality scores than non-PI researchers (p<0.001).
In terms of brokerage roles, PI’s continued to serve more often in coordinator, representative, gatekeeper, and liaison roles than non-PI members (all p<0.001) at Wave 2, while the itinerant broker role remained non-statistically different between PI and non-PI members (p>0.10).
Individuals with a prior history in NIDA-funded predecessor research networks continued to report more ties sent (p<0.001) and received (p<0.001) versus other network members at Wave 2. Those with prior history on average had higher betweenness centrality scores (p<0.001) compared to those without prior history. Members with prior history were also serving in more brokerage roles than those without a prior history (all p<0.01 with the exception of itinerant broker roles).
3.4. Collaboration Network Dynamics: Changes in Network Measures Between Wave 1 and Wave 2
Table 4 summarizes changes in brokerage and centrality scores over the network’s initial year.
Table 4:
Changes in brokerage and central positions from Wave 1 (baseline) to Wave 2
| Network Statistics | Changes over first year (Wave 2 mimis Wave 1) | |||||
|---|---|---|---|---|---|---|
| Role | Prior History | Centers | ||||
|
| ||||||
| Non-PI | PI | Prior Experience | No Prior Experience | Research Centers | Analytic/Coordinating | |
|
| ||||||
| Brokerage Roles (Center- based) | ||||||
| Coordinator | 0.30 (6.68) | −1.56 (15.51) | −4.03 (14.01) | 1.08+ (7.89) | −0.60 (6.17) | 0.93 (17.42) |
| Itinerant Broker | −0.19 (1.39) | 0.33 (3.51) | −0.38 (3.30) | 0.08 (1.70) | −0.15 (2.37) | 0.30 (1.62) |
| Representative | 11.58* (36.32) | 27.64*** (53.81) | 18.62* (46.75) | 15.38*** (41.18) | 8.39* (28.07) | 40.97** (65.86) |
| Gatekeeper | 7.93 (24.29) | 26.31*** (55.85) | 20.53** (51.95) | 10.71* (30.18) | 6.86 (30.89) | 33.37** (47.00) |
| Liaison | 7.45 (29.28) | 98.81 (180.40) | 69.72 (177.33) | 21.39 (65.78) | 25.07 (81.46) | 61.27 (163.46) |
| Centrality | ||||||
| Indegree (Ties Received) | 2.18 (3.50) | 6.03 (4.99) | 2.97 (3.58) | 3.40 (4.58) | 2.46 (3.69) | 5.90 (5.18) |
| Outdegree (Ties Sent) | 2.60 (6.16) | 5.00 (10.99) | 3.81 (7.90) | 3.11 (7.92) | 2.02 (6.99) | 7.30+ (9.27) |
| Betweenness | −0.00 (0.01) | −0.01 (0.02) | −0.01 (0.02) | −0.00 (0.01) | −0.00 (0.01) | −0.00 (0.01) |
| Closeness | 0.01 (0.15) | 0.01 (0.20) | 0.03 (0.10) | −0.00 (0.18) | −0.00 (0.17) | 0.04 (0.12) |
Note:
p< 0.001;
p< 0.01;
p< 0.05;
p< 0.10; difference between Wave 1 and Wave 2 tested using permutation test. Betweenness Centrality scores are normalized. For Coordinator, Itinerant Broker, Representative, Gatekeeper, and Liaison the average frequencies are shown. Degree, Closeness, and Betweenness Centralities are continuous measures hence mean values are shown.
Principal investigators.
A seen in Table 4, for individuals in formal investigator roles, the maximum possible number of new collaborations available to be formed by Wave 2 was 941; 15.6% of these (147 out of 941) were realized. After controlling for the general increase in the number of collaborations within the JCOIN researcher network, the number of new ties received and sent by PI’s were no greater than expected. In terms of brokerage roles, PIs had a greater-than-expected increase in the representative role (p<0.001) and gatekeeper role (p<0.05) from Wave 1 to Wave 2, controlling for network densities.
Amongst other research team members (non-PIs), the number of possible new ties was 7418 and just 166 were realized (2.23%). While these researchers experienced an increase in ties on average, this was not statistically significant after controlling for the overall increase in network ties from Wave 1 to Wave 2. Non-PIs also saw an increase in the number of times they served as representative brokers (p<0.05), but not in other brokerage roles.
Prior history in JCOIN’s predecessor networks.
Whether an individual had experience in prior NIDA research networks did not have a significant influence on increasing collaborations between Wave 1 and Wave 2. Researchers with and without prior network experience showed greater than expected increases in serving both representative brokerage roles (p<0.001 both groups) and gatekeeper roles (p<.05 both groups).
Center affiliation.
Members affiliated with the coordinating/analytic centers had larger than expected increases in the number of ties sent (p=0.06) by Wave 2, but no significant change in ties received. These members also showed a greater than expected increase in representative (p<.001) and gatekeeper (p<.001) roles. By contrast, individuals in the research centers showed greater than expected increases in the number of representative roles served (p<.05) but were not different than expected on any other network measure.
4. Discussion
These analyses describe the growth of collaborative ties over the first year of a new network. Participants are affiliated with research centers executing complex multisite clinical trials. Each research team draws its staff from multiple institutions, many of which had not collaborated prior to these projects. Accordingly, most of the newly realized ties in the first year of this network occurred within the individual research centers. When asked to describe the nature of new collaborations with other network members, 49% of newly formed ties related to developing or executing one or more research projects – these ties predominantly reflected new collaborations within the research centers as they launched their JCOIN studies and related activities. A far smaller proportion of new ties were attributed to publishing papers (12% of new ties), delivering conference presentations (8%), or organizing workshops or similar events (8%); such opportunities are limited in the early stages of research projects. About 14% of new ties resulted from working together on JCOIN workgroups or committees, which reflect collaborations between research hubs. The remaining 9% of new ties were classified by respondents as “other” collaborations (data not shown).
Seniority of network members was an important predictor of existing and new collaborative ties. Principal Investigators – individuals in the most senior roles on their respective teams – reported double the number of ties at baseline compared to other team members, and reported a larger growth in ties by Wave 2. PI’s also expanded their representative and gatekeeper roles by Wave 2: PI’s were the primary point of contact for their own centers; made connections with their staff in response to inquiries from other centers (gatekeeper role); and directly connected with members of other centers (representative role). Relatively few new ties had been formed among non-PI’s over the initial year of the network. In their study of the formative years of a new cancer research network, Basner et al. (2013) also found that PI’s accounted for much of the early collaborative ties, and further characterized their roles to include leadership of communication within and between teams, with funders and stakeholders, and with institutional leadership – all of which are crucial as new network hubs are becoming established.
Given the nature of their roles in the network, it was expected that members of the coordinating and analytic centers would account for significantly more new ties in the first year, and this was reflected in the data. In particular, staff in these centers functioned in a significantly greater than expected number of gatekeeper roles. Because these centers are large and complex, with multiple points of contact responsible for distinct tasks and services, many staff in each center routinely field inquiries from the research centers, and help connect them with the appropriate team member. Likewise, their significant increase in gatekeeper roles over time reflects the expectations of the coordinating and analytic centers in reaching out to identify appropriate expertise within the research centers, or offer consultation on specific activities.
Finally, the network-wide survey asked all members to account for collaborations that pre-dated the network. Because members of several (but not all) of the research centers had participated with each other in prior NIDA-funded research networks, there was the possibility that they would have had an advantage in forming additional new collaborations within JCOIN. This turned out not to be the case. Prior experience did not predict the formation of new ties, nor did it convey an advantage in the creation of brokerage roles. By contrast, research on the formative year of a transdisciplinary cancer research network (Hall et al., 2008) found that histories of prior collaboration increased the “collaborative readiness” of participating investigators. This could become a predictor of future collaborative outputs, to be measured at a later stage of the network.
4.1. Lessons Learned
It may be the case that the structure of this network – as initially established by the funding agency – was determinative of the patterns seen in the development of early collaborative ties. The formation of new ties between research centers in the first year was largely limited to the senior-most members (Principal Investigators) and to the members of the coordinating centers, all of whom held the overwhelming proportion of representative and gatekeeper brokerage roles. Individuals occupying the PI roles were conferred network leadership status from the outset – e.g., with voting roles on the Steering Committee and as primary communicators between their centers and the funding agency. Likewise, the coordinating and analytic centers were designated as the key connectors among the participating centers and were viewed as foundational infrastructure for facilitating network activities. Additionally, at the outset, each PI was assigned a co-chair role on a workgroup, and thus had more opportunities to interact with researchers across the network.
The initial workgroups were functional in nature – that is, they were tasked with establishing policies and procedures for the network, and thus provided few opportunities for substantive scientific collaboration that would result in measurable output. By Year 2, network members began to form interest groups on substantive topics of common interest (e.g., impacts of COVID-19 on study populations; research on stigma; implementation science) and pursued opportunities to seek additional grant funding for related research. Thus while the network structure may have limited early collaboration, it appears sufficiently malleable to allow organic collaborations to emerge.
Sponsors of newly formed research networks may benefit from utilizing social network analysis as a project management tool, to identify opportunities for formal or informal intervention to actively encourage additional collaborations, and to better engage outlier members into the network’s activities. Individuals who emerge as key brokers early on may be good candidates for encouraging greater collaboration among unconnected network members (Valente, 2012; Vogel et al., 2014). For example, some CTSA programs have utilized network surveys to systematically identify unconnected researchers working in potentially complementary fields, and intervened to create these connections and even provide pilot funding to support collaborative research (Sciabolazza et al., 2020; Vacca et al., 2015). Other examples suggest that strategically creating, disbanding, or reconfiguring workgroups can help create new ties for isolated network members, and potentially broaden the diffusion of information across the network (Ribisl et al., 2017; Woodland et al., 2021). These types of interventions are likely feasible within a broad array of networks and with relatively little added cost or burden.
4.2. Limitations and Future Work
We note several limitations of these analyses, including contextual and methodological factors, as well as the exclusive focus on individuals in researcher roles.
Pandemic disruptions and network ties.
Many activities that had been planned for JCOIN’s first year (September 2019 – September 2020) were significantly disrupted by the COVID-19 pandemic, and these could have had an unmeasured impact on the formation of new collaborative ties during this period. Research centers’ studies had been scheduled to launch in Spring 2020, but were delayed upwards of a full year due to necessary safety protocols that restricted in-person data collection and limited access to study sites. This in turn reduced the frequency and intensity of planned interactions between the research teams and the analytic center (because data were not being processed) and the coordination center (because study findings were not being generated or disseminated).
Likewise, planned in-person meetings of the network’s steering committee and research team members were not held in 2020, nor did members have the opportunity to engage in person at national conferences or similar venues that are natural incubators for collaboration. While the network continued to hold virtual meetings, it was inevitable that research teams spent most of 2020 focused on their own projects, which likely explains the relative growth of intra-center ties by Wave 2. Claudel et al. (2017) found that geographic distance was a limiting factor for collaboration among researchers on an urban university campus; it remains to be seen how the extended restrictions imposed by COVID-19 also inhibit collaborative output in a more dispersed network. A repeat of the network survey data collection one year post-COVID will allow us to better understand any sustained impact of relying on virtual interaction during the network’s formative period.
Methodological limitations.
Our analysis is limited in dealing with potential network dependencies of collaboration ties. In addition, our focus on the research centers as the basis for brokerage roles could be better described in terms of a combined structure of brokerage and degree centrality, or brokerage-centrality conjugated structures (Fujimoto et al., 2021). For example, a broker PI becomes popular by receiving increased intra- or inter-center collaboration offers (i.e., generating locally centralized brokerage structure) which may cause bottlenecks in collaboration. Future research could benefit from specifying such local structures and use a longitudinal network modeling approach such as the temporal exponential random graph model (TERGM) (Hanneke, Fu, & Xing, 2010) or the stochastic actor-oriented model for network dynamics (Snijders et al., 2010).
The analyses conducted in this study primarily focused on three actor attributes (covariates): PI status, prior history in one of the predecessor networks, and center affiliation. Naturally, these variables are somewhat correlated with one another (Chi-square test p=0.053 for PI status and prior history; p=0.056 for PI status and center affiliation; and p=0.127 for prior history and center affiliation). Studies with larger samples could account for this intercorrelation by controlling for more than one variable in the permutation test procedure.
Influence of additional network participants.
These analyses are also limited to individuals occupying traditional researcher roles in the JCOIN initiative. We have not yet considered the role of each center’s practitioner partners in the network, nor its influence on their collaborative ties. While the pandemic upended research in numerous ways, its impacts were far greater within the settings and systems that are central to JCOIN’s focus – justice systems (jails, prisons, courts) and behavioral healthcare services. The pandemic also influenced the relationships between the researchers and their practitioner partners as they worked together to navigate sudden new realities. Future surveys will seek to capture and measure impacts of this shared experience on collaborative ties, both within the clinical trials and beyond. We will also examine whether the return to face-to-face Steering Committee meetings and professional conferences results in a further expansion of collaborations across the network, and in turn how these collaborations influence traditional measures of productivity (publications, grant applications, etc.). Finally, looking beyond the finite duration of this research network, we hope to examine whether collaborative ties have a sustained impact on clinical practice and future research-practice partnerships.
4.3. Conclusions
It is common for network analyses of collaborative research endeavors to focus on output in the form of publications (bibliometrics) and other objective measures of productivity. But understanding the factors that drive or inhibit the early formation of collaborative ties is important because these lay the foundation for future collaboration. Building rapport and trust, as well as establishing a common infrastructure to facilitate collaboration, is critical for supporting the production of collaborative output. Through the use of a whole-network survey, we were able to demonstrate the growth of collaborative ties in a new research network’s initial year and further understand the key network positions that drive these collaborations.
While these analyses focus on a single, fairly homogeneous network, these findings contribute to a growing body of research on the management, funding, and facilitation of team science. NIH and other funders of scientific research often manage collections of related grant awards as research networks, providing centralized infrastructure to coordinate activities across studies, convene meetings of grantees, support harmonization of measures and methods, and create centralized data repositories for data sharing and collaborative analyses. Philosophically, such an approach fosters team science by facilitating interactions across research teams and thereby creating a culture of collaboration. Practically, however, these networks vary in their scientific content, scope, membership, and resources, which means each may differ in the degree of collaboration achieved.
Some large, established research networks have utilized social network analyses to measure collaborative output and impact of these initiatives. Comparatively more “science of team science” research has focused on these robust, mature networks that have years of experience to draw upon. By contrast, the formative years of a new network offer opportunities to see how new collaborative ties are formed – who brings existing relationships, status, or experience that might confer an advantage in developing collaborative ties, and how this contributes to the growth of the network. More attention to these formative processes may allow both participants and funders to maximize the potential of these networks to foster collaborations early on, and accelerate their impact on both research and practice.
Highlights:
New research networks offer opportunities to observe how collaborative ties are formed
Persons in high status positions, or with prior research network experience, may play central roles
Social network analyses were used to identify individuals in key bridging and broker roles
Network position was associated with collaborative ties at baseline and one year later
Role of the Funding Source
This research was supported by grant U2CDA050098, from the National Institute on Drug Abuse, National Institutes of Health, through the NIH HEAL Initiative. This is a cooperative agreement, and Dr. Ducharme’s involvement in this research is consistent with her role as the appointed NIDA Science Officer. The funding agency otherwise had no role in study design; in the collection, analysis and interpretation of data; in the writing of the report; or in the decision to submit the article for publication. The contents of this publication are solely the responsibility of the authors and do not represent the official views of NIDA or the NIH HEAL Initiative.
Biographies
Lori Ducharme, PhD is Health Scientist Administrator in the Division of Epidemiology, Services and Prevention Research at the National Institute on Drug Abuse, National Institutes of Health. Her research examines the implementation of evidence-based addiction treatment services in specialty care, general medicine, and criminal justice settings.
Kayo Fujimoto, PhD is a Professor at UTHealth and Sally W. Vernon Distinguished Professorship in Social Determinants of Health. Her research specializes in the development and application of social network methodologies, various statistical methods, deep learning methods, and agent-based network models to various areas of population health research from a multidisciplinary perspective in order to address the social determinants of health. Her research topics include HIV/AIDS & STIs, men who have sex with men (MSM) populations, molecular epidemiology, community organizational networks, and healthcare delivery systems.
Jacky Kuo, BS is a PhD candidate in the Biostatistics and Data Science Department at UTHealth the School of Public Health. His research focuses on the development of clustering methodology and its applications in public health. His research topics include infectious diseases such as COVID-19, HIV, and STIs from a social network perspective. He is interested in the applications of social network modelling and machine learning approaches to uncover the drivers of latent clustering.
Jonathan Stewart, PhD is Assistant Professor in the Department of Statistics at Florida State University. His research focuses on statistical models and theory for dependent data with applications to network data, and interests lying broadly in the field of statistical network analysis. Fundamentally, he is interested in understanding how to model dependent data for complex structures in order to obtain tractable computational methods and desirable statistical guarantees and theory. He has studied applications to social networks, brain networks, and HIV / public health.
Bruce Taylor, PhD is a Senior Fellow in Public Health for NORC at the University of Chicago. His research explores the intersecting areas of violence, health, and criminal justice. His work includes multi-method approaches using nationally representative household panels; organizational surveys with service providers, jails, and law enforcement; and the collection of survey and biospecimen data. He leads the survey program for the Justice Justice-Community Opioid Innovation Network’s (JCOIN), Methodology and Advanced Analytics Resource Center (MAARC) and has focused on exploring the general public’s views towards opioid use, treatment, and social stigma towards opioid use.
John Schneider, MD is Professor of Medicine, Epidemiology and Social Work at the University of Chicago. He is an applied network scientist employing social-, sexual- and molecular network analyses to accelerate substance use, STI/HIV care continuum and other prevention intervention programs in the United States. His work has prioritized health equity among marginalized populations, including substance users, Black men, and criminal justice involved populations (and the intersection of these groups). He is also an Infectious Disease clinician, and is Medical Director of Howard Brown Health 55th Street, a Federally Qualified Health Center in South Chicago.
Footnotes
Declaration of Competing Interests
The authors report no declarations of interest.
CRediT authorship contribution statement
Lori J. Ducharme: conceptualization; writing – original draft; writing – review & editing. Kayo Fujimoto: formal analysis; writing – original draft. Jacky Kuo: formal analysis; visualization; writing – original draft. Jonathan Stewart: formal analysis. Bruce Taylor: methodology; investigation; project administration; writing – review & editing. John Schneider: methodology; writing – review & editing.
Publisher's Disclaimer: This is a PDF file of an unedited manuscript that has been accepted for publication. As a service to our customers we are providing this early version of the manuscript. The manuscript will undergo copyediting, typesetting, and review of the resulting proof before it is published in its final form. Please note that during the production process errors may be discovered which could affect the content, and all legal disclaimers that apply to the journal pertain.
References
- Basner JE, Theisz KI, Jensen US, Jones CD, Ponomarev I, et al. (2013). Measuring the evolution and output of cross-disciplinary collaborations within the NCI physical sciences-oncology centers network. Research Evaluation, 22, 285–297. 10.1093/reseval/rvt025 [DOI] [PMC free article] [PubMed] [Google Scholar]
- Bian J, Xie M, Topaloglu U, Hudson T, Eswaran H, & Hogan W (2014). Social network analysis of biomedical research collaboration networks in a CTSA institution. Journal of Biomedical Informatics, 52, 130–140. 10.1016/j.jbi.2014.01.015 [DOI] [PMC free article] [PubMed] [Google Scholar]
- Burt RS (2005). Brokerage and Closure: An Introduction to Social Capital. New York, NY: Oxford University Press,. [Google Scholar]
- Burt RS (2010). Neighbor Networks. Oxford: Oxford University Press,. [Google Scholar]
- Cancian F (1979). The Innovator’s Situation: Upper-middle-class Conservatism in Agricultural Communities. Palo Alto, CA: Stanford University Press,. [Google Scholar]
- Claudel M, Massaro E, Santi P, Murray F, & Ratti C (2017). An exploration of collaborative scientific production at MIT through spatial organization and institutional affiliation. PLOS ONE, 12(6), Article e0179334. 10.1371/journal.pone.0179334 [DOI] [PMC free article] [PubMed] [Google Scholar]
- Dhand A, Luke DA, Carothers BJ, & Evanoff BA (2016). Academic cross-pollination: The role of disciplinary affiliation in research collaboration. PLOS ONE, 11(1), Article e0145916. 10.1371/journal.pone.0145916 [DOI] [PMC free article] [PubMed] [Google Scholar]
- Ducharme LJ, Wiley TRA, Mulford CF, Su Z-I., & Zur JB. (2021). Engaging the justice system to address the opioid crisis: The Justice Community Opioid Innovation Network (JCOIN). Journal of Substance Abuse Treatment, 128, 108307. 10.1016/j.jsat.2021.108307. [DOI] [PMC free article] [PubMed] [Google Scholar]
- Everett MG, & Valente TW (2016). Bridging, brokerage and betweenness. Social Networks, 44, 202–208. 10.1016/j.socnet.2015.09.001 [DOI] [PMC free article] [PubMed] [Google Scholar]
- Fernandez RM, & Gould RV (1994). A dilemma of state power: Brokerage and influence in the national health policy domain. The American Journal of Sociology, 99, 1455–1491. [Google Scholar]
- Fonseca B, Sampaio RB, Fonseca M, & Zicker F (2016). Co-authorship network analysis in health research: Method and potential use. Health Research Policy and Systems, 14(1), Article 34. 10.1186/s12961-016-0104-5 [DOI] [PMC free article] [PubMed] [Google Scholar]
- Freeman LC (1978). Centrality in social networks conceptual clarification. Social Networks, 1(3), 215–239. 10.1016/0378-8733(78)90021-7 [DOI] [Google Scholar]
- Fujimoto K, Hallmark CJ, Mauldin RL, Kuo J, Smith C, Del Vecchio N, … Wang P (2021). Brokerage-centrality conjugates for multi-level organizational field networks: Toward a blockchain implementation to enhance coordination of healthcare delivery. In Weber MS, & Yanovitzky I (Eds.), Networks, Knowledge Brokers, and the Public Policymaking Process (pp. 265–314). Springer International Publishing. 10.1007/978-3-030-78755-4_11. [DOI] [Google Scholar]
- Gould RV, & Fernandez RM (1989). Structures of mediation: A formal approach to brokerage in transaction networks. Sociological Methodology, 19, 89. 10.2307/270949 [DOI] [Google Scholar]
- Hall KL, Stokols D, Moser R, Taylor BK, Thornquist MD, et al. (2008). The collaboration readiness of transdisciplinary research teams and centers: Findings from the National Cancer Institute’s TREC year-one evaluation study. American Journal of Preventive Medicine, 35(2S), S161–S172. 10.1016/j.amepre.2008.03.035 [DOI] [PMC free article] [PubMed] [Google Scholar]
- Hanneke S, Fu W, & Xing EP (2010). Discrete temporal models of social networks. Electronic Journal of Statistics, 4. 10.1214/09-EJS548 [DOI] [Google Scholar]
- Hoff PD, Raftery AE, & Handcock MS (2002). Latent space approaches to social network analysis. Journal of the American Statistical Association, 97(460), 1090–1098. 10.1198/016214502388618906 [DOI] [Google Scholar]
- Holme P, & Ghoshal G (2009). The diplomat’s dilemma: Maximal power for minimal effort in social networks. In Gross T, & Sayama H (Eds.), Adaptive Networks: Theory, Models and Applications (pp. 269–288). Springer. 10.1007/978-3-642-01284-6_13. [DOI] [Google Scholar]
- Institute of Medicine. (2013). The CTSA Program at NIH: Opportunities for Advancing Clinical and Translational Research. National Academies Press,. 10.17226/18323 [DOI] [PubMed] [Google Scholar]
- Jacob RR, Korn AR, Huang GC, Easterling D, Gundersen DA, Ramanadhan S, Vu T, Angier H, Brownson RC, Haire-Joshu D, Oh AY, & Schnoll R (2022). Collaboration networks of the implementation science centers for cancer control: A social network analysis. Implementation Science Communications, 3(1), Article 41. 10.1186/s43058-022-00290-6 [DOI] [PMC free article] [PubMed] [Google Scholar]
- Laumann EO (1973). Bonds of Pluralism: The Form and Substance of Urban Social Networks. NY: John Wiley and Sons,. [Google Scholar]
- Long JC, Cunningham FC, Carswell P, & Braithwaite J (2013). Who are the key players in a new translational research network? BMC Health Services Research, 13 (1), Article 338. 10.1186/1472-6963-13-338 [DOI] [PMC free article] [PubMed] [Google Scholar]
- Long JC, Cunningham FC, Carswell P, & Braithwaite J (2014). Patterns of collaboration in complex networks: The example of a translational research network. BMC Health Services Research, 14(1), Article 225. 10.1186/1472-6963-14-225 [DOI] [PMC free article] [PubMed] [Google Scholar]
- Long JC, Hibbert P, & Braithwaite J (2015). Structuring successful collaboration: A longitudinal social network analysis of a translational research network. Implementation Science, 11(1), Article 19. 10.1186/s13012-016-0381-y [DOI] [PMC free article] [PubMed] [Google Scholar]
- Luke DA, Carothers BJ, Dhand A, Bell RA, Moreland-Russell S, Sarli CC, & Evanoff BA (2015). Breaking down silos: Mapping growth of cross-disciplinary collaboration in a translational science initiative. Clinical and Translational Science, 8 (2), 143–149. 10.1111/cts.12248 [DOI] [PMC free article] [PubMed] [Google Scholar]
- Nagarajan R, Peterson CA, Lowe JS, Wyatt SW, Tracy TS, & Kern PA (2015). Social network analysis to assess the impact of the CTSA on biomedical research grant collaboration. Clinical and Translational Science, 8(2), 150–154. 10.1111/cts.12247 [DOI] [PMC free article] [PubMed] [Google Scholar]
- Newman MEJ (2004). Coauthorship networks and patterns of scientific collaboration. Proceedings of the National Academy of Sciences, 101(suppl_1), 5200–5205. 10.1073/pnas.0307545100 [DOI] [PMC free article] [PubMed] [Google Scholar]
- Ribisl KM, Fernandez ME, Friedman DB, Hannon PA, Leeman J, et al. (2017). Impact of the cancer prevention and control research network: Accelerating the translation of research into practice. American Journal of Preventive Medicine, 52 (3S3), S233–S240. 10.1016/j.amepre.2016.08.026 [DOI] [PMC free article] [PubMed] [Google Scholar]
- Sciabolazza VL, Vacca R, & McCarty C (2020). Connecting the dots: Implementing and evaluating a network intervention to foster scientific collaboration and productivity. Social Networks, 61, 181–195. 10.1016/j.socnet.2019.11.003 [DOI] [Google Scholar]
- Snijders TAB, van de Bunt GG, & Steglich CEG (2010). Introduction to stochastic actor-based models for network dynamics. Social Networks, 32(1), 44–60. 10.1016/j.socnet.2009.02.004 [DOI] [Google Scholar]
- Vacca R, McCarty C, Conlon M, & Nelson DR (2015). Designing a CTSA-based social network intervention to foster cross-disciplinary team science. Clinical and Translational Science, 8, 281–289. 10.1111/cts.12267 [DOI] [PMC free article] [PubMed] [Google Scholar]
- Valente TW (2012). Network interventions. Science, 337, 49–53. [DOI] [PubMed] [Google Scholar]
- Valente TW, & Fujimoto K (2010). Bridging: Locating critical connectors in a network. Social Networks, 32(3), 212–220. 10.1016/j.socnet.2010.03.003 [DOI] [PMC free article] [PubMed] [Google Scholar]
- Vogel AL, Stipelman BA, Hall KL, Nebeling L, Stokols D, & Spruijt-Metz D (2014). Pioneering the transdisciplinary team science approach: Lessons learned from National Cancer Institute grantees. Journal of Translational and Medical Epidemiology, 2(2), 1027. [PMC free article] [PubMed] [Google Scholar]
- Woodland RH, Douglas J, & Matuszczak D (2021). Assessing organizational capacity for diffusion: A school-based social network analysis case study. Evaluation and Program Planning, 89, Article 101995. 10.1016/j.evalprogplan.2021.101995 [DOI] [PubMed] [Google Scholar]
- Zhang Y, Wang L, & Diao T (2013). The quantitative evaluation of the clinical and translational science awards (CTSA) program based on science mapping and scientometric analysis: Quantitative evaluation of the CTSA program. Clinical and Translational Science, 6(6), 452–457. 10.1111/cts.12078 [DOI] [PMC free article] [PubMed] [Google Scholar]