
Figure 3.
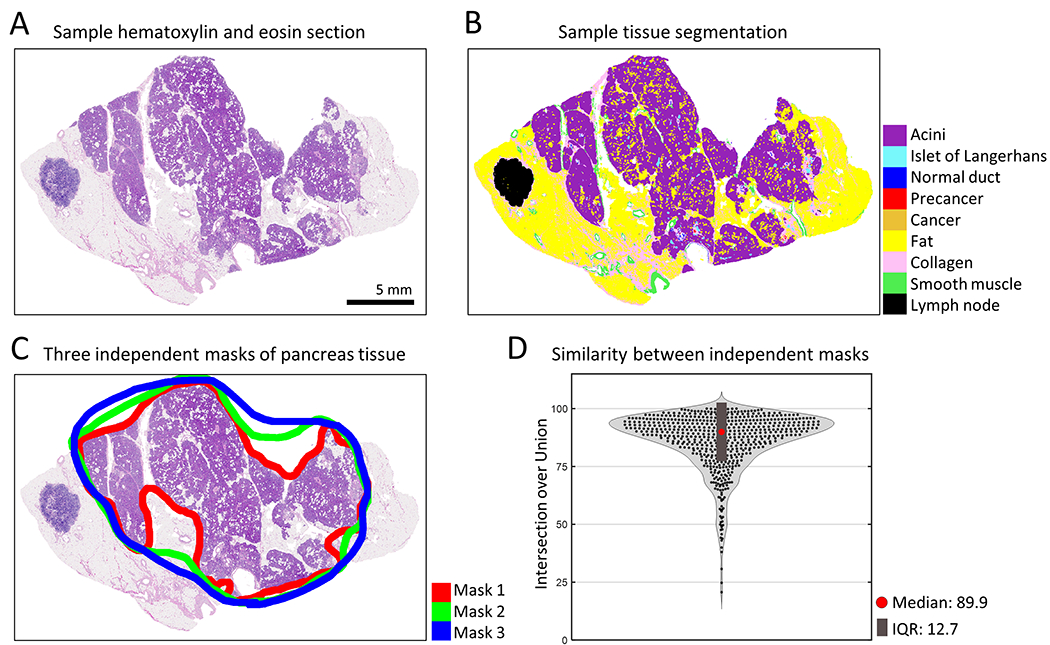
Measuring microanatomical pancreatic tissue. (a) Example of a hematoxylin and eosin (H&E) stained section of human pancreas. (b) Deep learning semantic segmentation of H&E section allows quantification of eleven pancreatic tissue components. (c) Manual annotation of pancreatic tissue by three independent researchers allows exclusion of structures such as lymph nodes and extra-pancreatic fat. (d) A violin plot displays the similarity between the three researchers’ annotations of pancreatic tissue area per histologic image. Intersection over union of the annotated tissue area was calculated for each image. Median: 89.9%, Interquartile range (IQR): 12.7%.