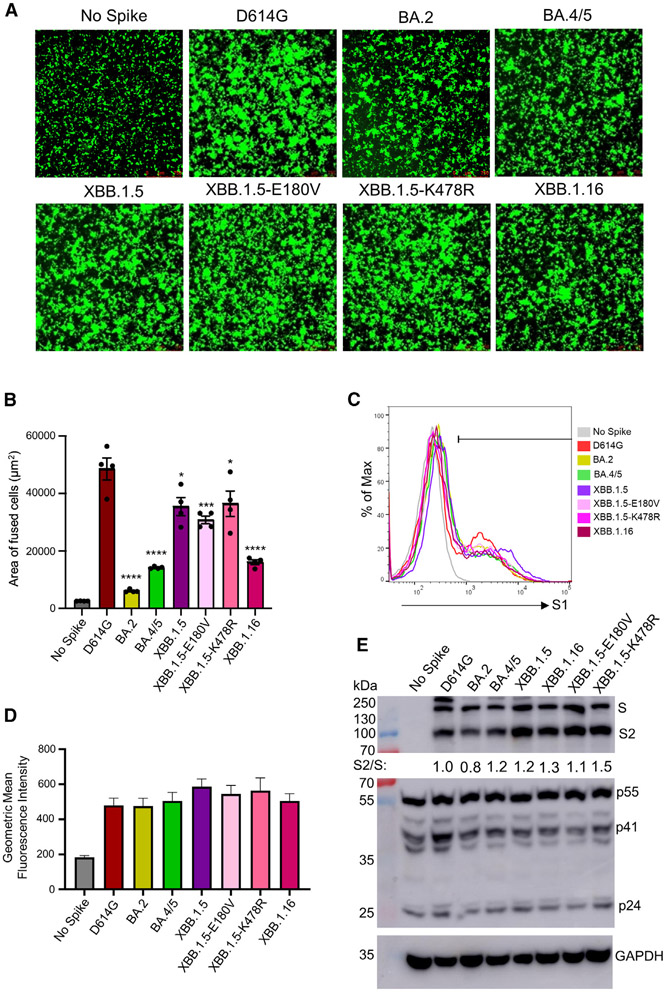
Figure 4. Expression, fusion, and processing of S proteins of XBB.1.16.
(A and B) Fusogenicity of the S proteins. HEK293T-ACE2 cells were transfected with S proteins of interest and GFP and incubated for 24 h. Syncytia formation was imaged using fluorescence microscopy (A), with total areas of fused cells quantified (B). Bars represent means ± standard error, and dots represent two biological replicates with two random areas for each replicate. Significance relative to D614G was determined using a one-way repeated measures ANOVA with Bonferroni’s multiple testing correction (n = 4). “No Spike” refers to the negative control, which was transfected with GFP and empty pcDNA3.1 plasmid. Significance between XBB.1.5 and XBB.1.16 was determined by unpaired two-sided Student’s t tests.
(C and D) The expression level of XBB.1.16 S on the plasma membrane was determined by flow cytometry on HEK293T cells transfected with S and probed with polyclonal anti-S1 antibody. Three technical replicates were performed, and no significant difference was detected between the variants. The geometric mean fluorescence values were averaged and plotted, and an overlaid representative histogram was selected to represent the comparison between each of the variants. Bars represent means ± standard error.
(E) The S processing was determined through the lysis of HEK293T cells producing lentiviral pseudotypes and the probing for the S2 subunit of S specifically through immunoblotting. Relative S processing was determined by quantifying the band intensities using NIH ImageJ and calculating a ratio between S2 and S. Ratios were normalized to D614G and are listed below the anti-S2 blot (D614G = 1.0). The lysate was also probed with anti-p24 (HIV structural proteins, transfection control) and GAPDH (loading control) antibodies. p values are displayed as *p < 0.05, ***p < 0.001, and ****p < 0.0001.

