FIGURE 5:

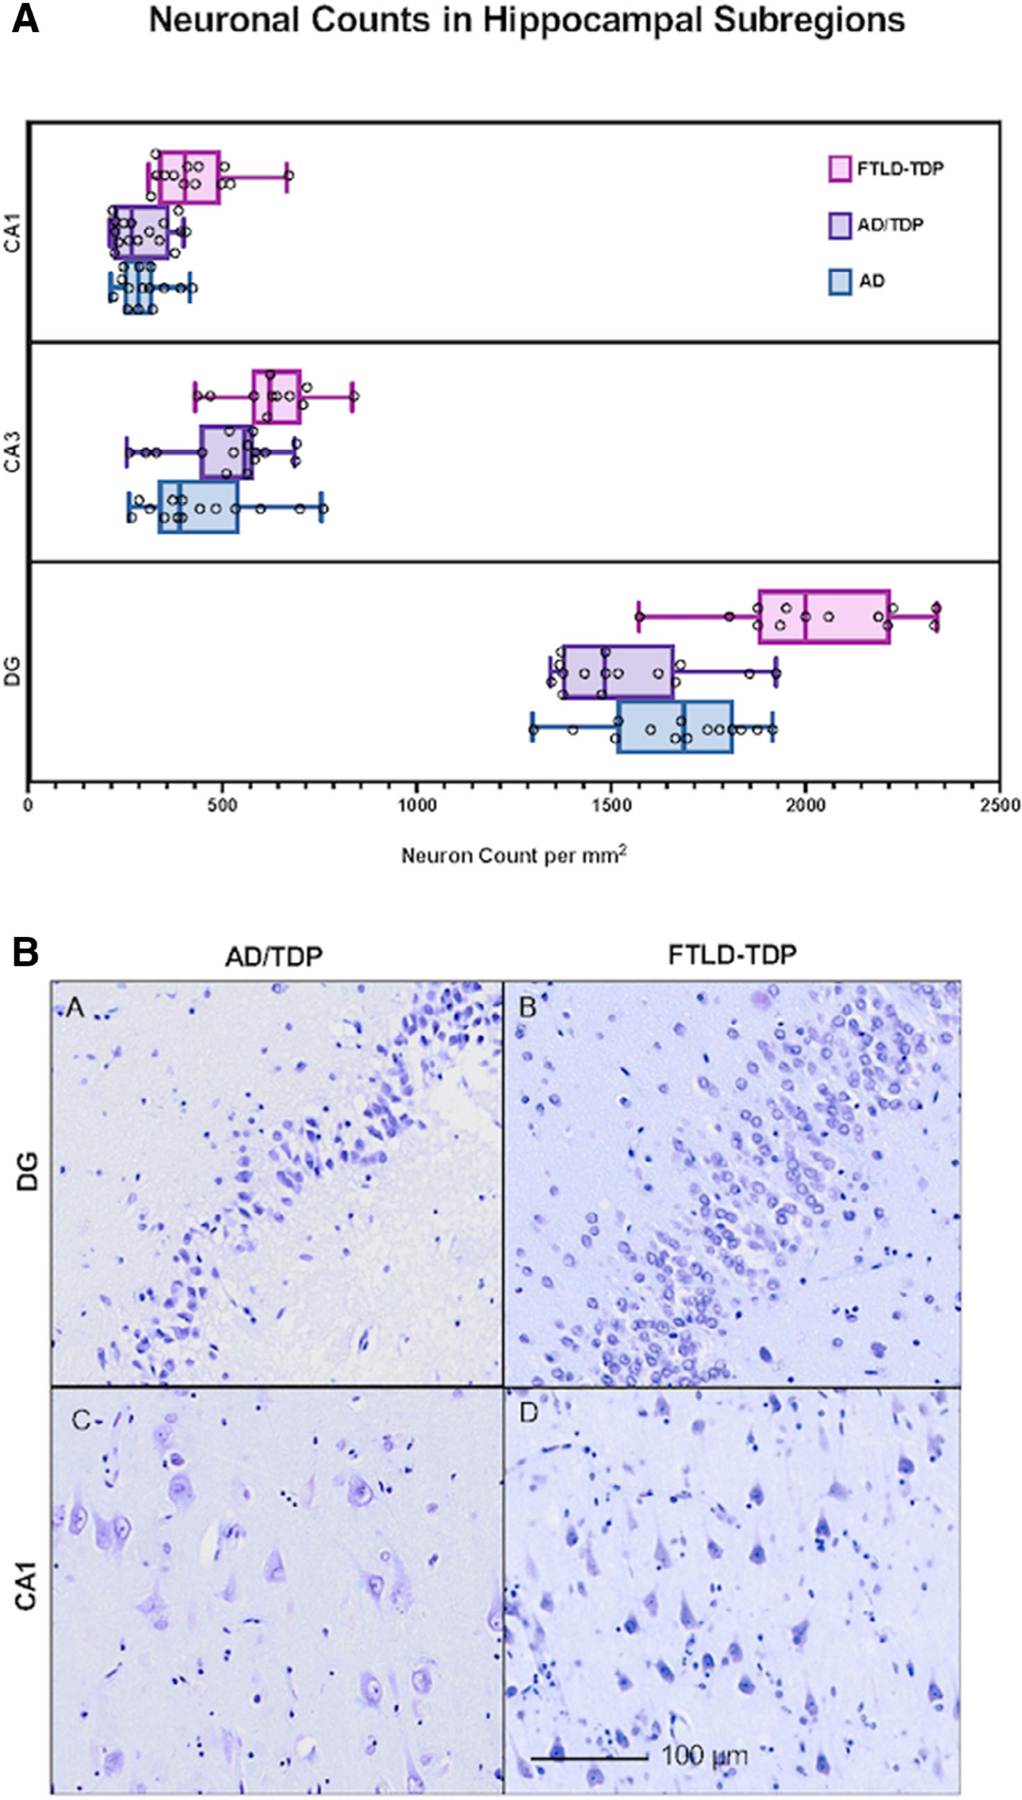
Neuronal counts in hippocampal subregions across amnestic and transactive response DNA-binding protein 43 proteinopathy associated with frontotemporal lobar degeneration (FTLD-TDP) cohorts. (A) Box plots show the distribution of neuronal counts. The box extends from the 25th percentile to the 75th percentile. The median is shown by a line, and “whiskers” extend from minimum to maximum counts. Individual dots represent neuronal counts in a single case. As expected, in all groups the granule cells of the dentate gyrus (DG) were most numerous given their high cell packing density, followed by CA3, then CA1. In accordance with the salience of the amnestic syndrome, the amnestic groups showed significantly lower neuronal counts compared to the FTLD-TDP group in CA1 and DG (p < 0.0001). (B) Photomicrograph of the dentate gyrus and CA1 region of hippocampus stained with cresyl violet to visualize neurons in individuals with AD/TDP versus FTLD-TDP; note significantly fewer neurons in AD/TDP. The FTLD-TDP case is a 65-year-old woman with a 13-year history of PPA found to have FTLD-TDP type C at autopsy, and the AD/TDP case is 83-year-old woman with an 18-year history of amnestic dementia (see Figs 2A and 3A).
