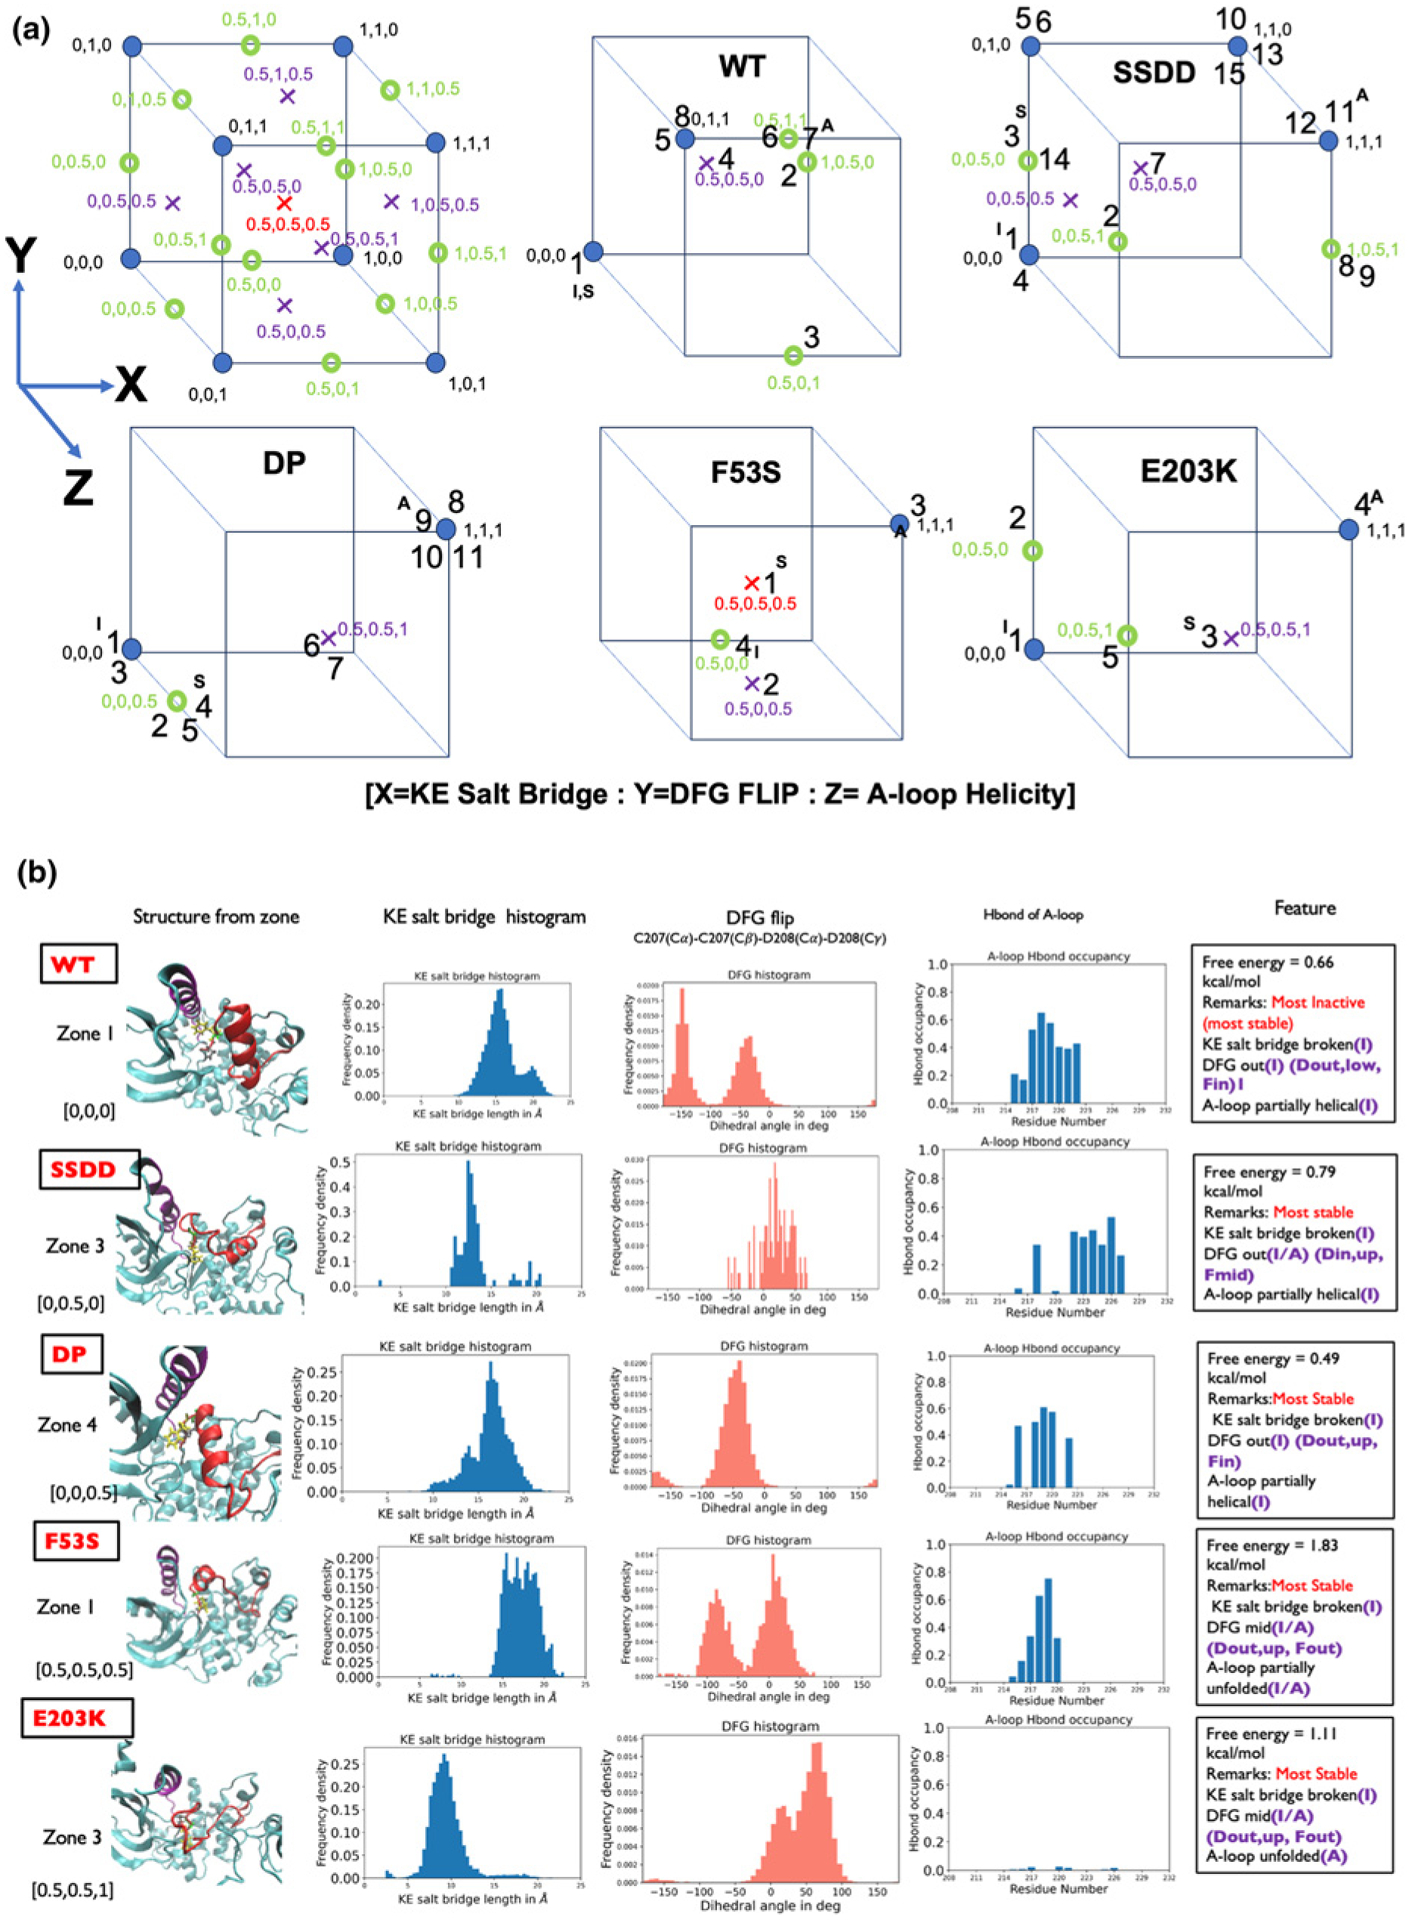
Figure 2.

The categorization of each of the zones is provided using the [X = KE salt bridge:Y = DFG flip: Z = A-loop helicity] convention based on the values of the three switch variables. Cubes depict the full extent of 25 states possible from the combinations of switch variables and the states populated in each MEK1 system. The numbers in each cube correspond to the zone numbers in the free energy plot and the inactive, stable, and active zones are marked with I, S, A, respectively. The comparison of switch variables of the most stable conformational state/zone across the five MEK1 systems.
