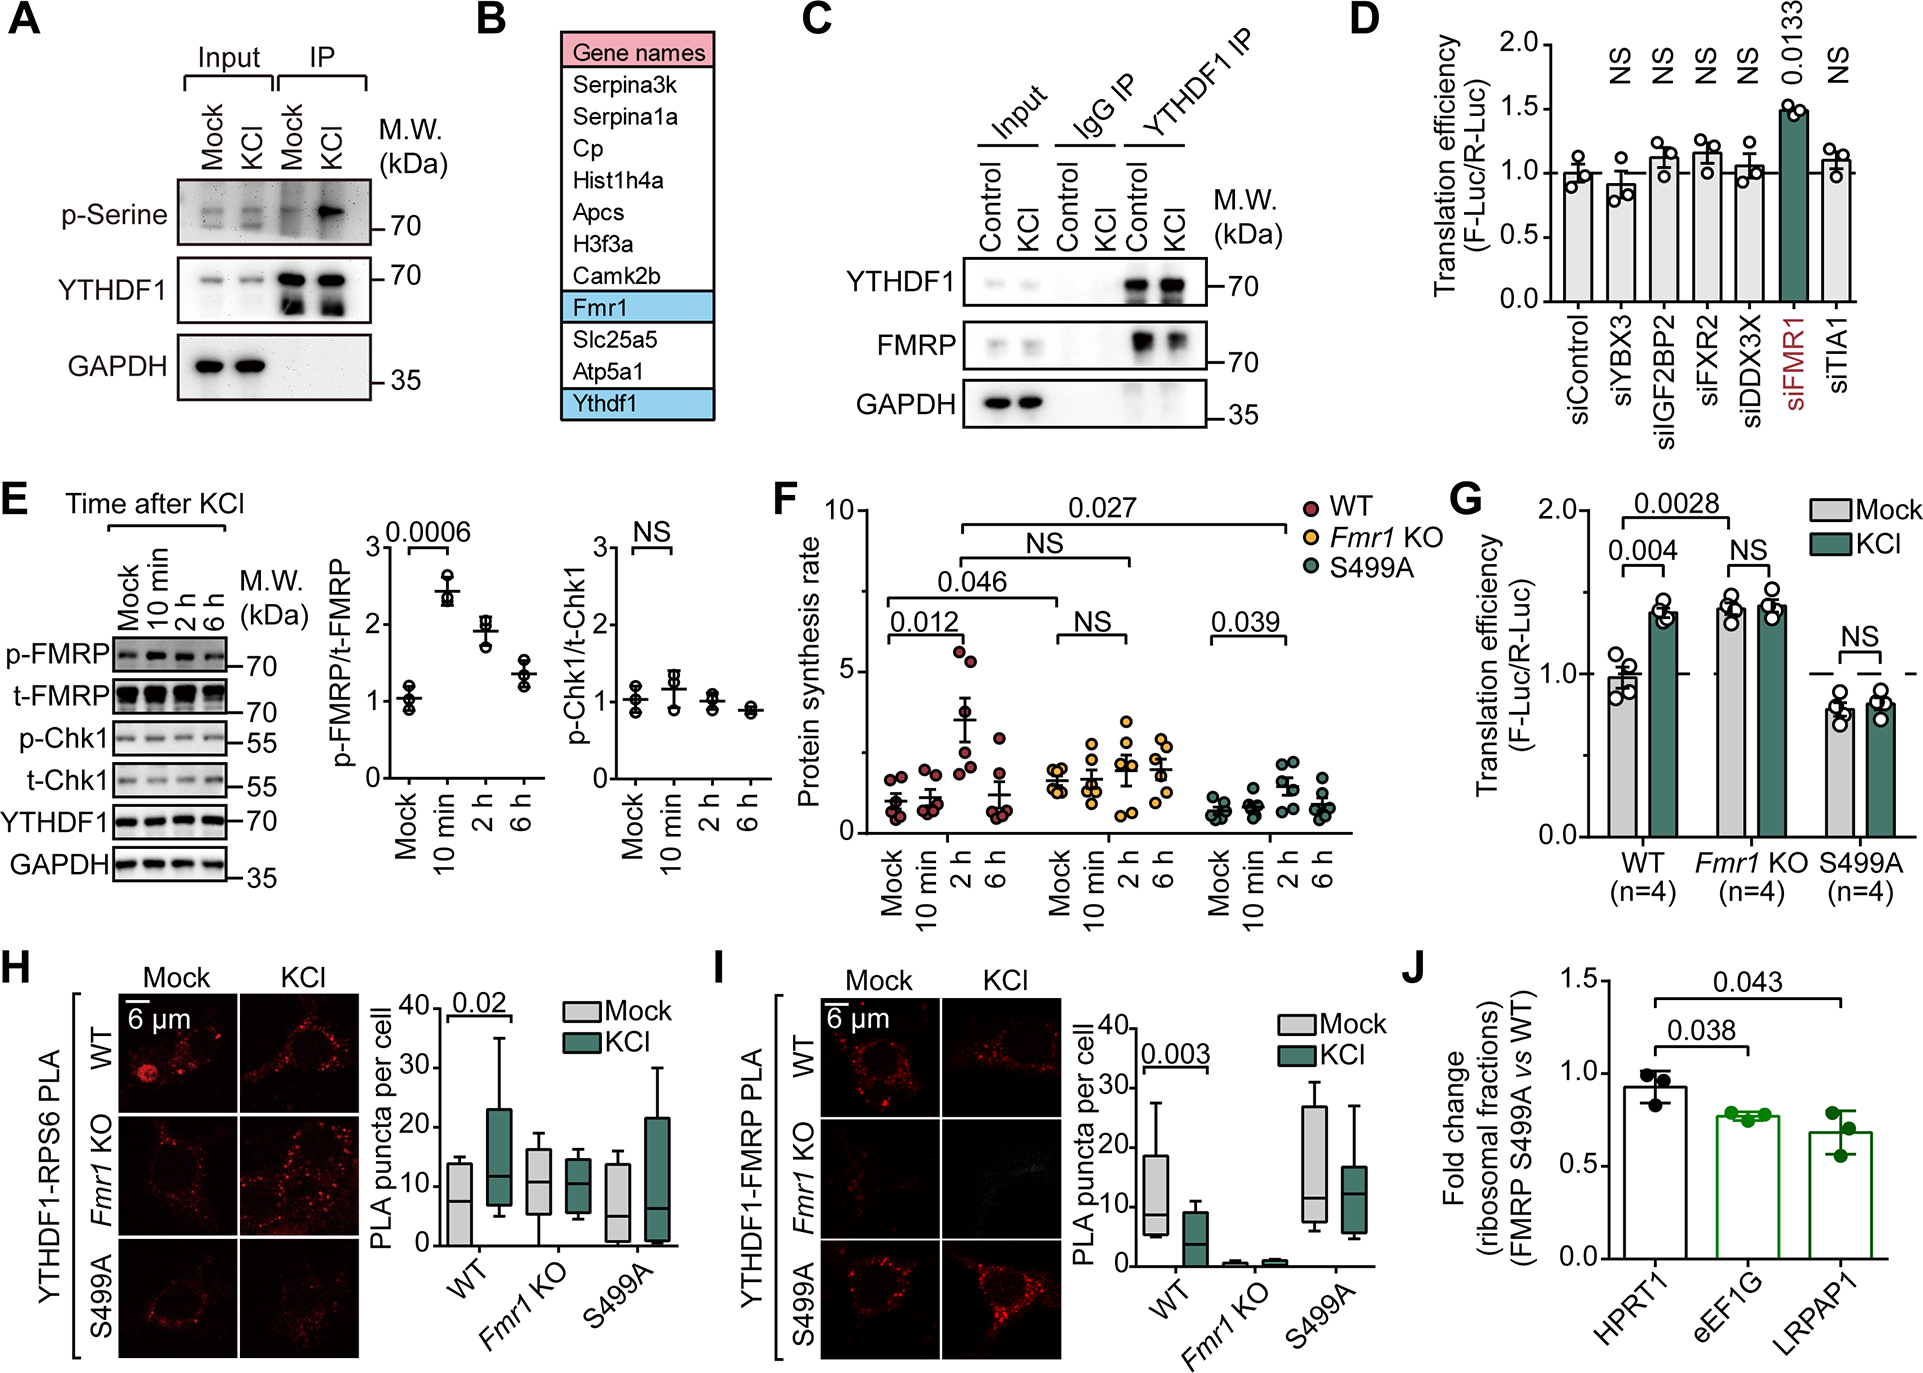
Figure 1. FMRP phosphorylation activates YTHDF1 upon neuronal stimulation.

(A) Western blot analysis of phosphorylated serine in YTHDF1 co-immunoprecipitated fractions.
(B) List of top 11 proteins identified from fractions co-immunoprecipitated with YTHDF1 with WT mice brain tissue. Proteins were listed by gene names and ordered by total peptide intensity for each protein.
(C) Western blot analysis of YTHDF1-FMRP interaction in cultured mouse neurons depolarized by 50 mM KCl for 10 minutes (KCl) or not (Control).
(D) Reporter assays of YTHDF1-mediated translation in HEK293T cells (n = 3). Proteins negatively regulating m6A-mediated translation were depleted individually.
(E) Western blots and dot plots showing the level of p-FMRP(S499) (p-FMRP) and p-Chk1(S345) (p-Chk1) in neuron lysates collected at different time points post KCl depolarization (Mock, 10 min, 2h and 6h).
(F) Quantification of protein synthesis rate measured by L-Homopropargylglycine (HPG) incorporation in mouse neurons (n = 6 for each condition).
(G) Translation efficiency of YTHDF1-mediated translation in cultured mouse neurons measured by reporter assays.
(H) Proximity ligation assays in cultured mouse neurons depolarized by 50 mM KCl (KCl) or not (Mock) against YTHDF1 and RPS6.
(I) Proximity ligation assays in cultured mouse neurons depolarized by 50 mM KCl (KCl) or not (Mock) against YTHDF1 and FMRP.
(J) Bar plots showing the effects of FMRP phosphor-null mutant (S499A) on the distribution of YTHDF1 targets in ribosomal fractions.
Data are mean ± s.e.m. (D), (E), (F), (G) and (J), P values were determined using a two-tailed t test with Welch’s correction. (H) and (I), P values were determined using a Wilcoxon ranked sum test. NS means not significant (P values > 0.05). Reported P values are for the individual comparisons. Box-plot elements: centre line, median; box limits, upper and lower quartiles; whiskers, 1–99%; error bars, 95% confidence interval of mean
