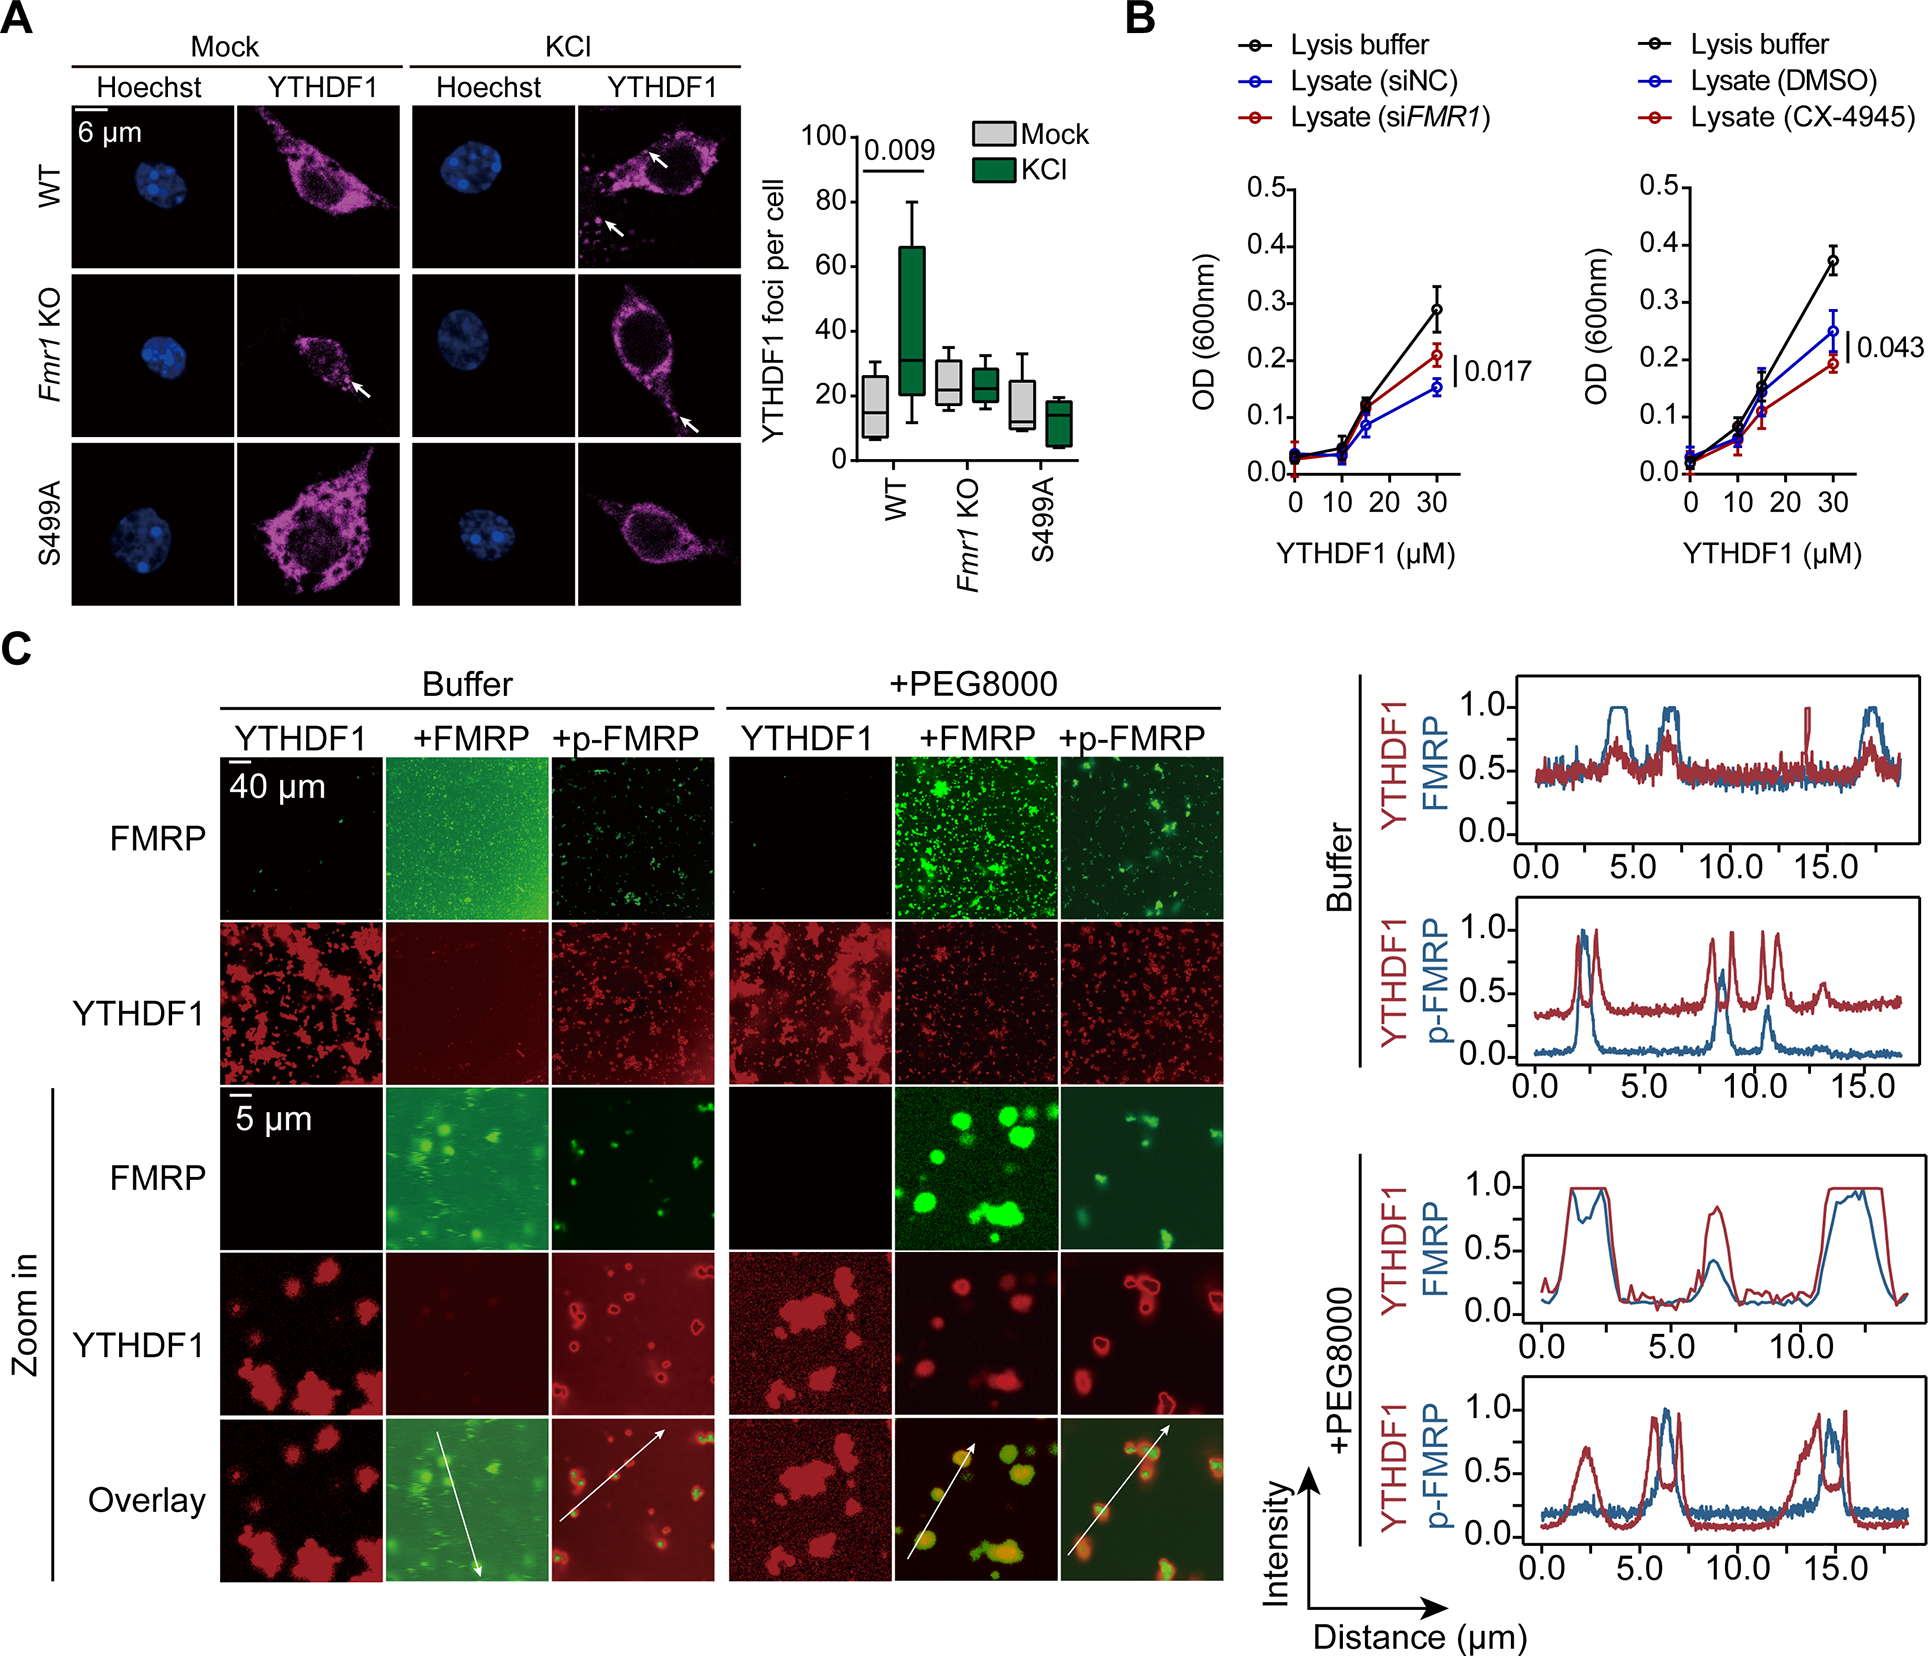
Figure 2. Unphosphorylated FMRP inhibits YTHDF1 condensation, phosphorylated FMRP does not.

(A) Representative images of cultured mouse neurons labeled using antibodies against YTHDF1. Left, representative images from three independent experiments; right, quantification of YTHDF1 puncta per cell.
(B) Line plots showing the condensation of YTHDF1 incubated with HeLa cell lysates. YTHDF1 condensation was quantified by turbidity measurement at optical density at 600 nm (OD600) in three independent experiments.
(C) Representative images of co-condensing of YTHDF1 with unphosphorylated or phosphorylated FMRP (n = 6). Intensity distribution on a line (as labeled in the figures) was quantified.
Data are mean ± s.e.m. P values were determined using a two-tailed unpaired t test with Welch’s correction. NS means not significant (P values > 0.05). Reported P values are for the individual comparisons. Box-plot elements: centre line, median; box limits, upper and lower quartiles; whiskers, 1–99%; error bars, 95% confidence interval of mean
