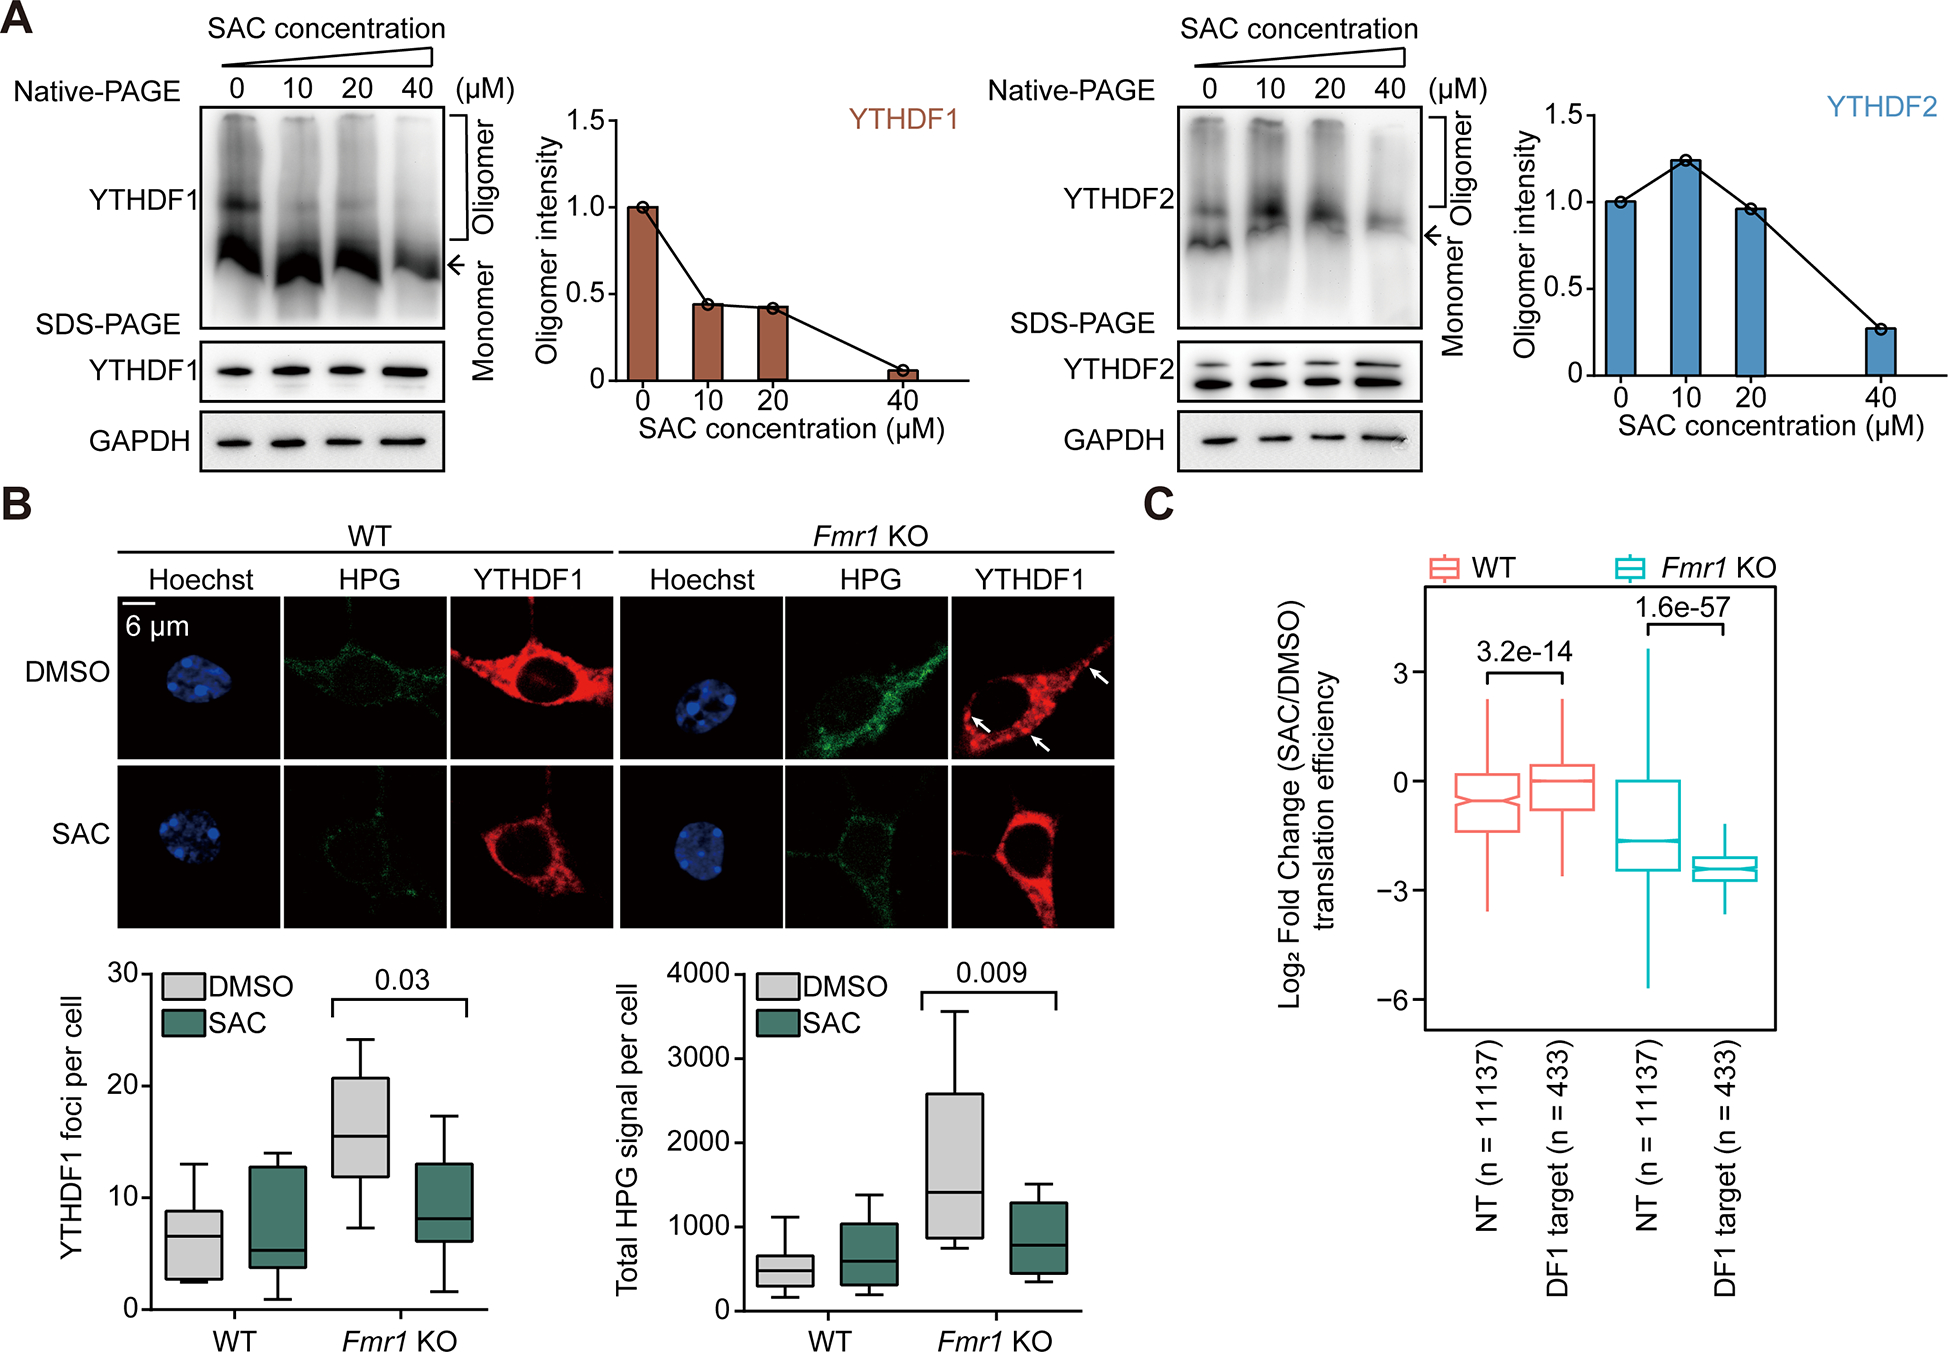
Figure 5. SAC inhibits YTHDF1 by suppressing YTHDF1 condensation.

(A) Analysis of YTHDF1 (left) or YTHDF2 (right) protein oligomers in cultured mouse neurons treated with SAC. YTHDF protein oligomers were visualized by Native-PAGE and loading controls were performed with denaturing SDS-PAGE.
(B) SAC treatment rescues aberrant YTHDF1 condensation and protein synthesis in Fmr1 KO neurons. Protein synthesis rates were measured by HPG incorporation in mouse neurons (n = 6 for each condition).
(C) Box plots showing the log2-transformed fold changes of the translation efficiency of YTHDF1 target transcripts (DF1 target) or non-targets (NT) in WT or Fmr1 KO mouse neurons upon SAC.
(B) and (C), P values were determined using a Wilcoxon ranked sum test. NS means not significant (P values > 0.05). Reported P values are for the individual comparisons. Box-plot elements: centre line, median; box limits, upper and lower quartiles; whiskers, 1–99%; error bars, 95% confidence interval of mean
