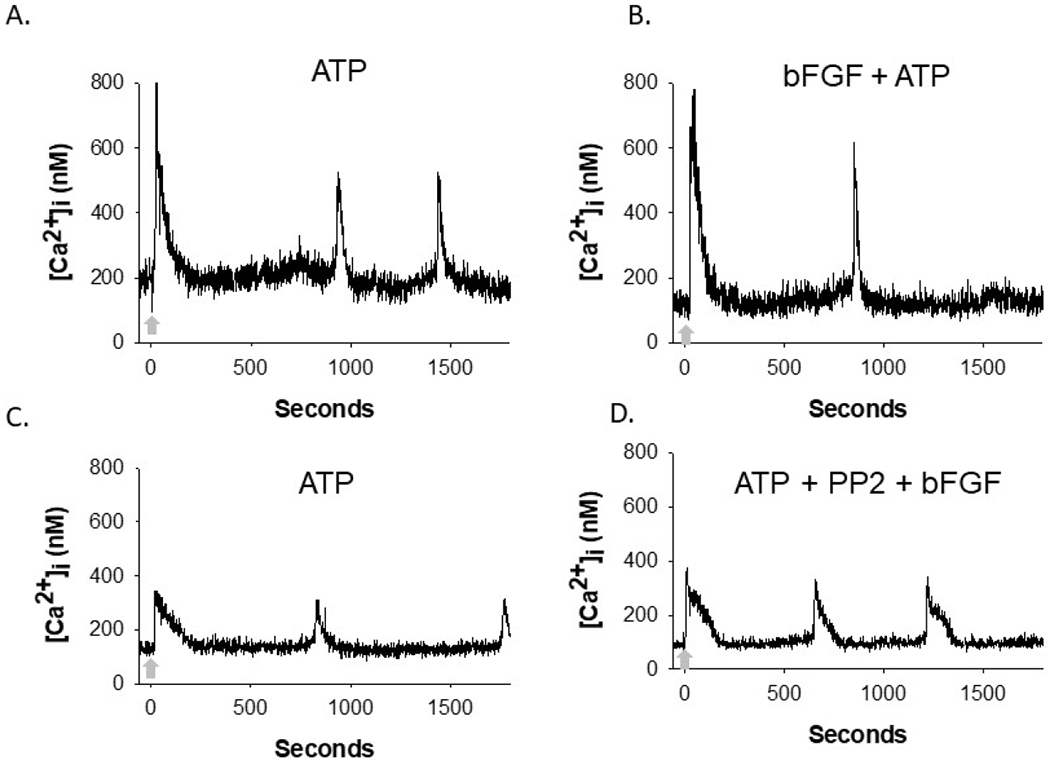
Figure 1: Representative tracings of Ca2+ bursting responses in individual HUVEC.

Confluent HUVEC were exposed to an initial 100 uM ATP stimulation prior to subsequent ATP stimulation (indicated by arrow) after inhibitor and growth factor or cytokine treatment, all while focus is retained on each individual cell. Here, bFGF treatment and bFGF with PP2 pretreatment representative tracings are shown as an example. Panels A and B display the same cell, with panel A showing its initial ATP stimulation, and panel B showing its subsequent ATP stimulation after it has been treated with bFGF. Panels C and D display the same cell, with panel C showing its initial ATP stimulation, and panel D showing its subsequent ATP stimulation after treatment with PP2 and bFGF. For quantitative analysis in Figures 2 and 3, the number of bursts counted in the second ATP stimulation (B or D) are compared to the initial, internal control, ATP stimulation (A or C) for each experimental condition.
