
Figure 1. Generation of Cntnap1 mouse mutants carrying human CNTNAP1 mutations and their phenotypic analysis.
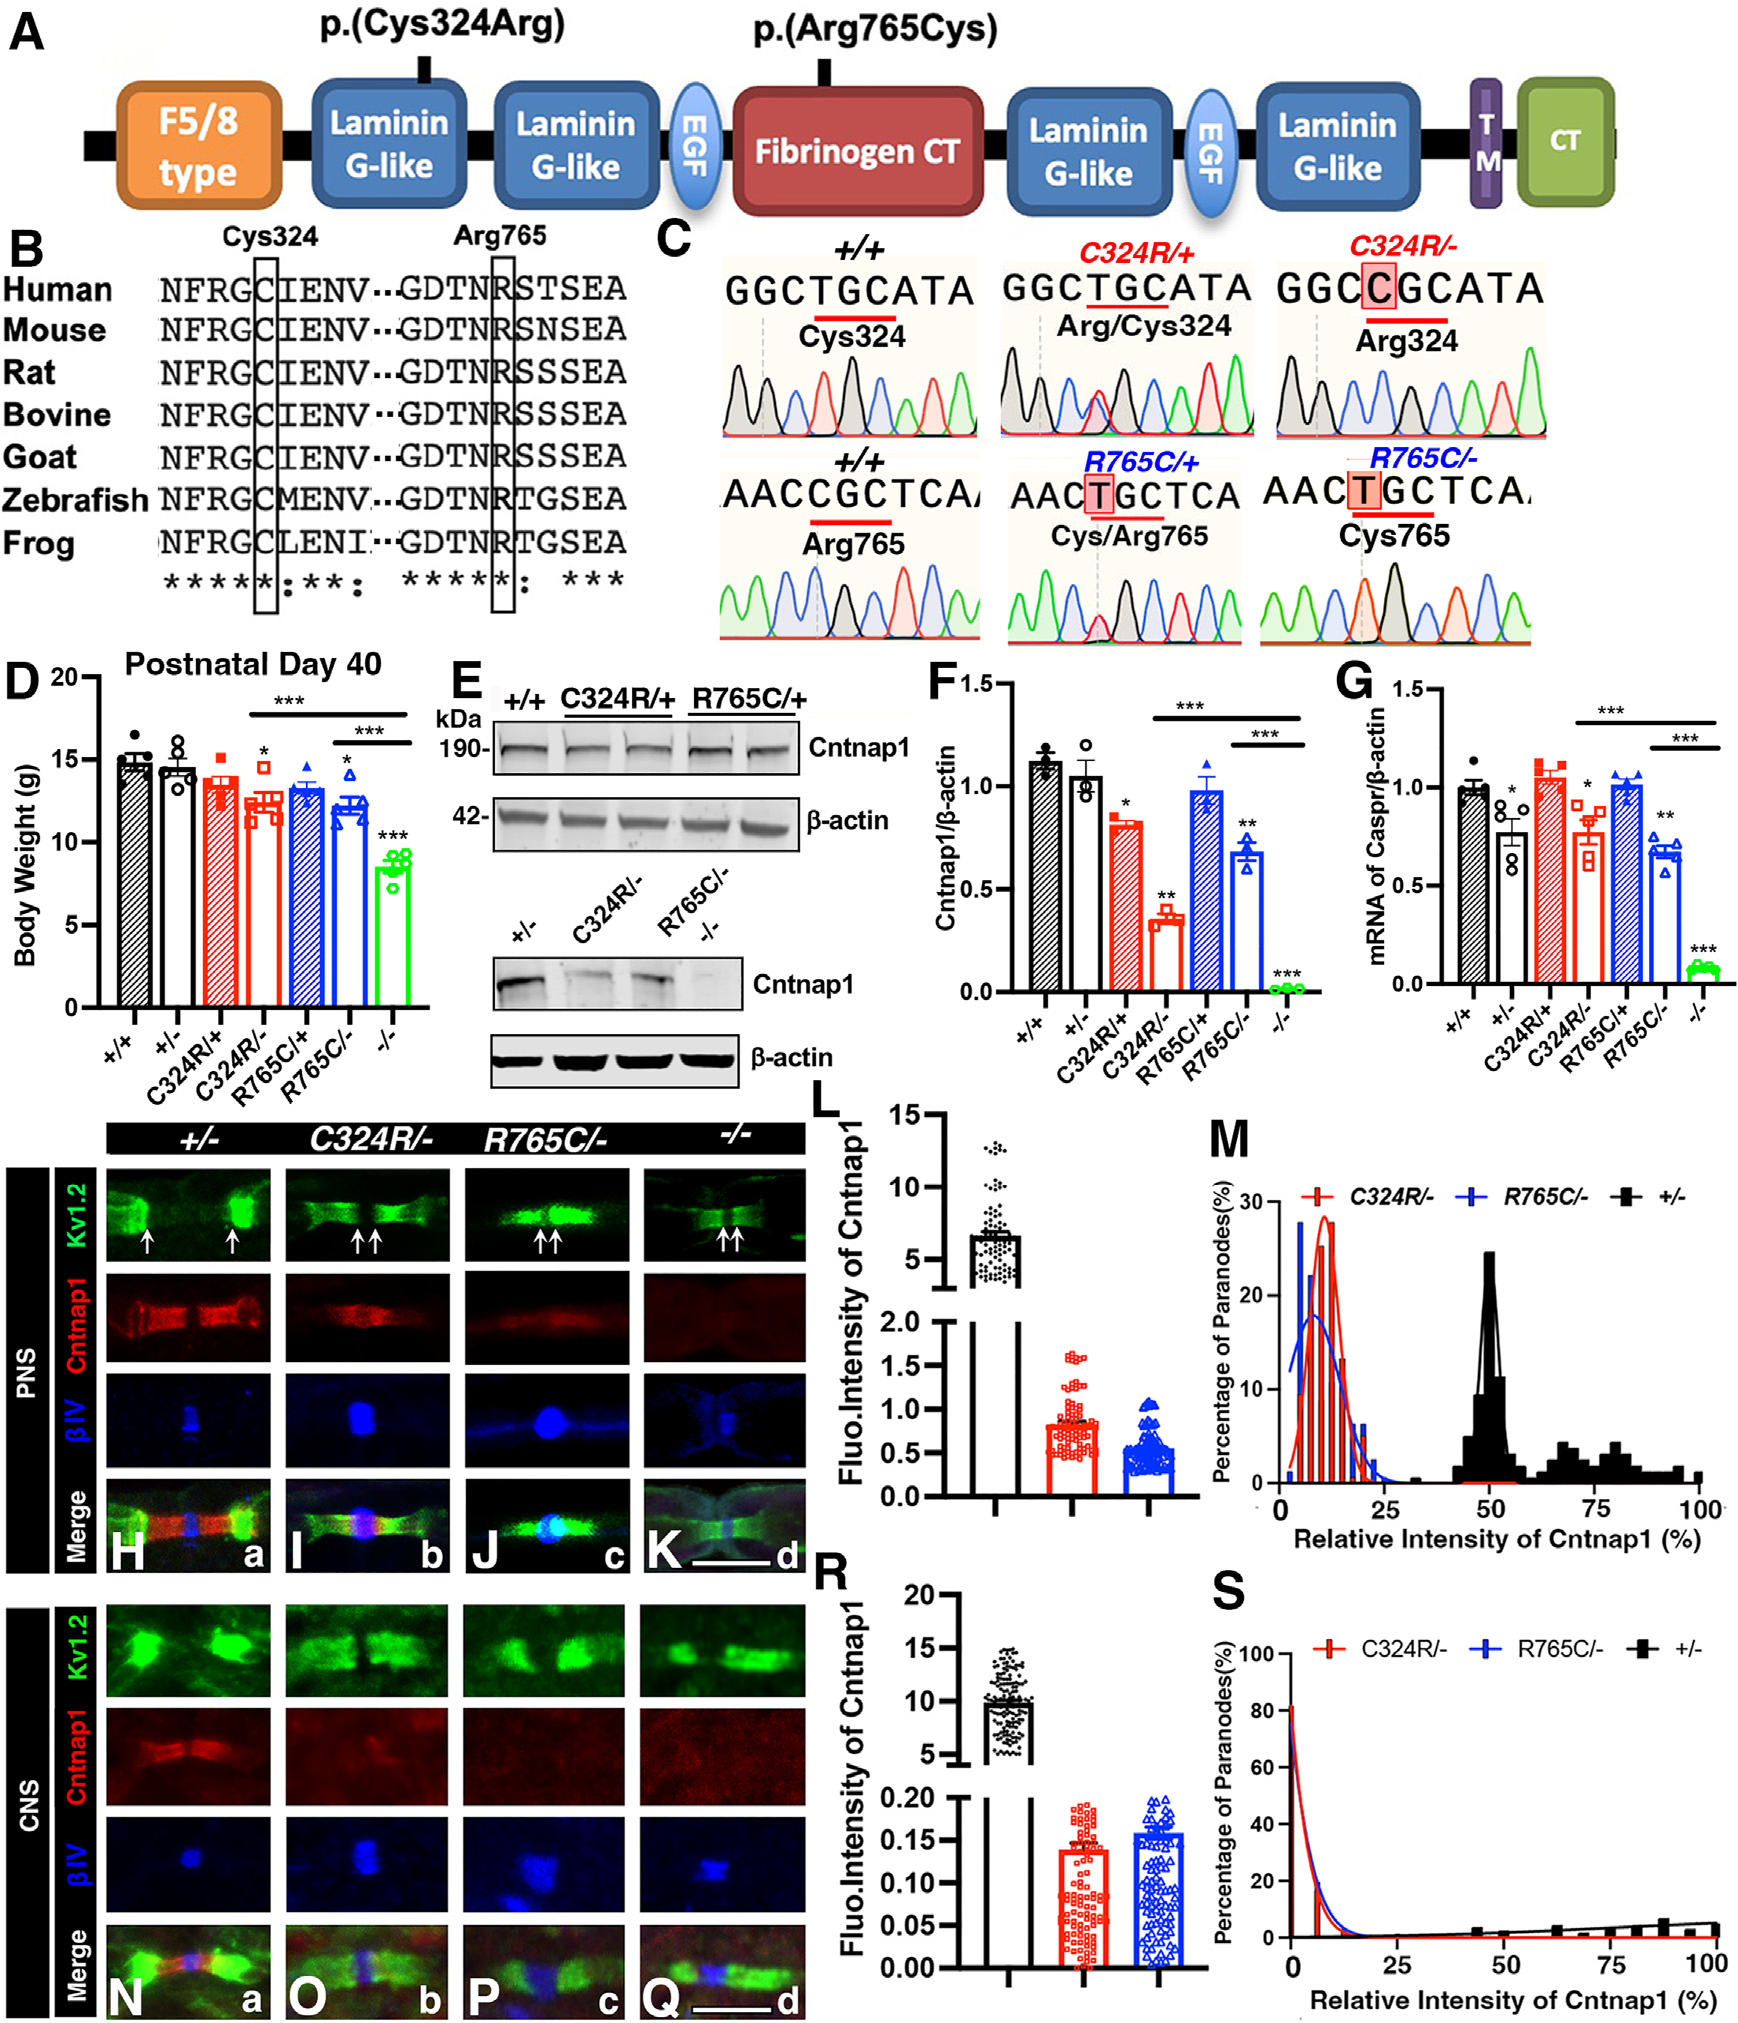
(A) Schematic of Cntnap1 protein and the approximate locations of amino acid changes.
(B) Sequence alignment of the Cntnap1 protein showing high conservation of Cys324 and Arg765 across multiple species.
(C) Genomic DNA sequences from wild-type controls and Cntnap1 mutants.
(D) Body weights at postnatal day 40.
(E) Immunoblots showing expression of Cntnap1 in the CNS (spinal cords). β-actin was used as loading control.
(F) Quantification of relative protein band intensities for Cntnap1 in the CNS.
(G) Quantification of relative mRNA expression for Cntnap1 in the CNS.
(H–K) Immunostaining of sciatic nerves. Scale bar: 5 μm.
(L and M) Measurement of relative fluorescence intensity and distribution of Cntnap1 at the paranodes in the sciatic nerves.
(N–Q) Immunostaining of spinal cords. Scale bar: 5 μm.
(R and S) Measurement of relative fluorescence intensity and distribution of Cntnap1 at the paranodes in the spinal cords. Data are represented as the mean ± SEM of three to six biological replicates.