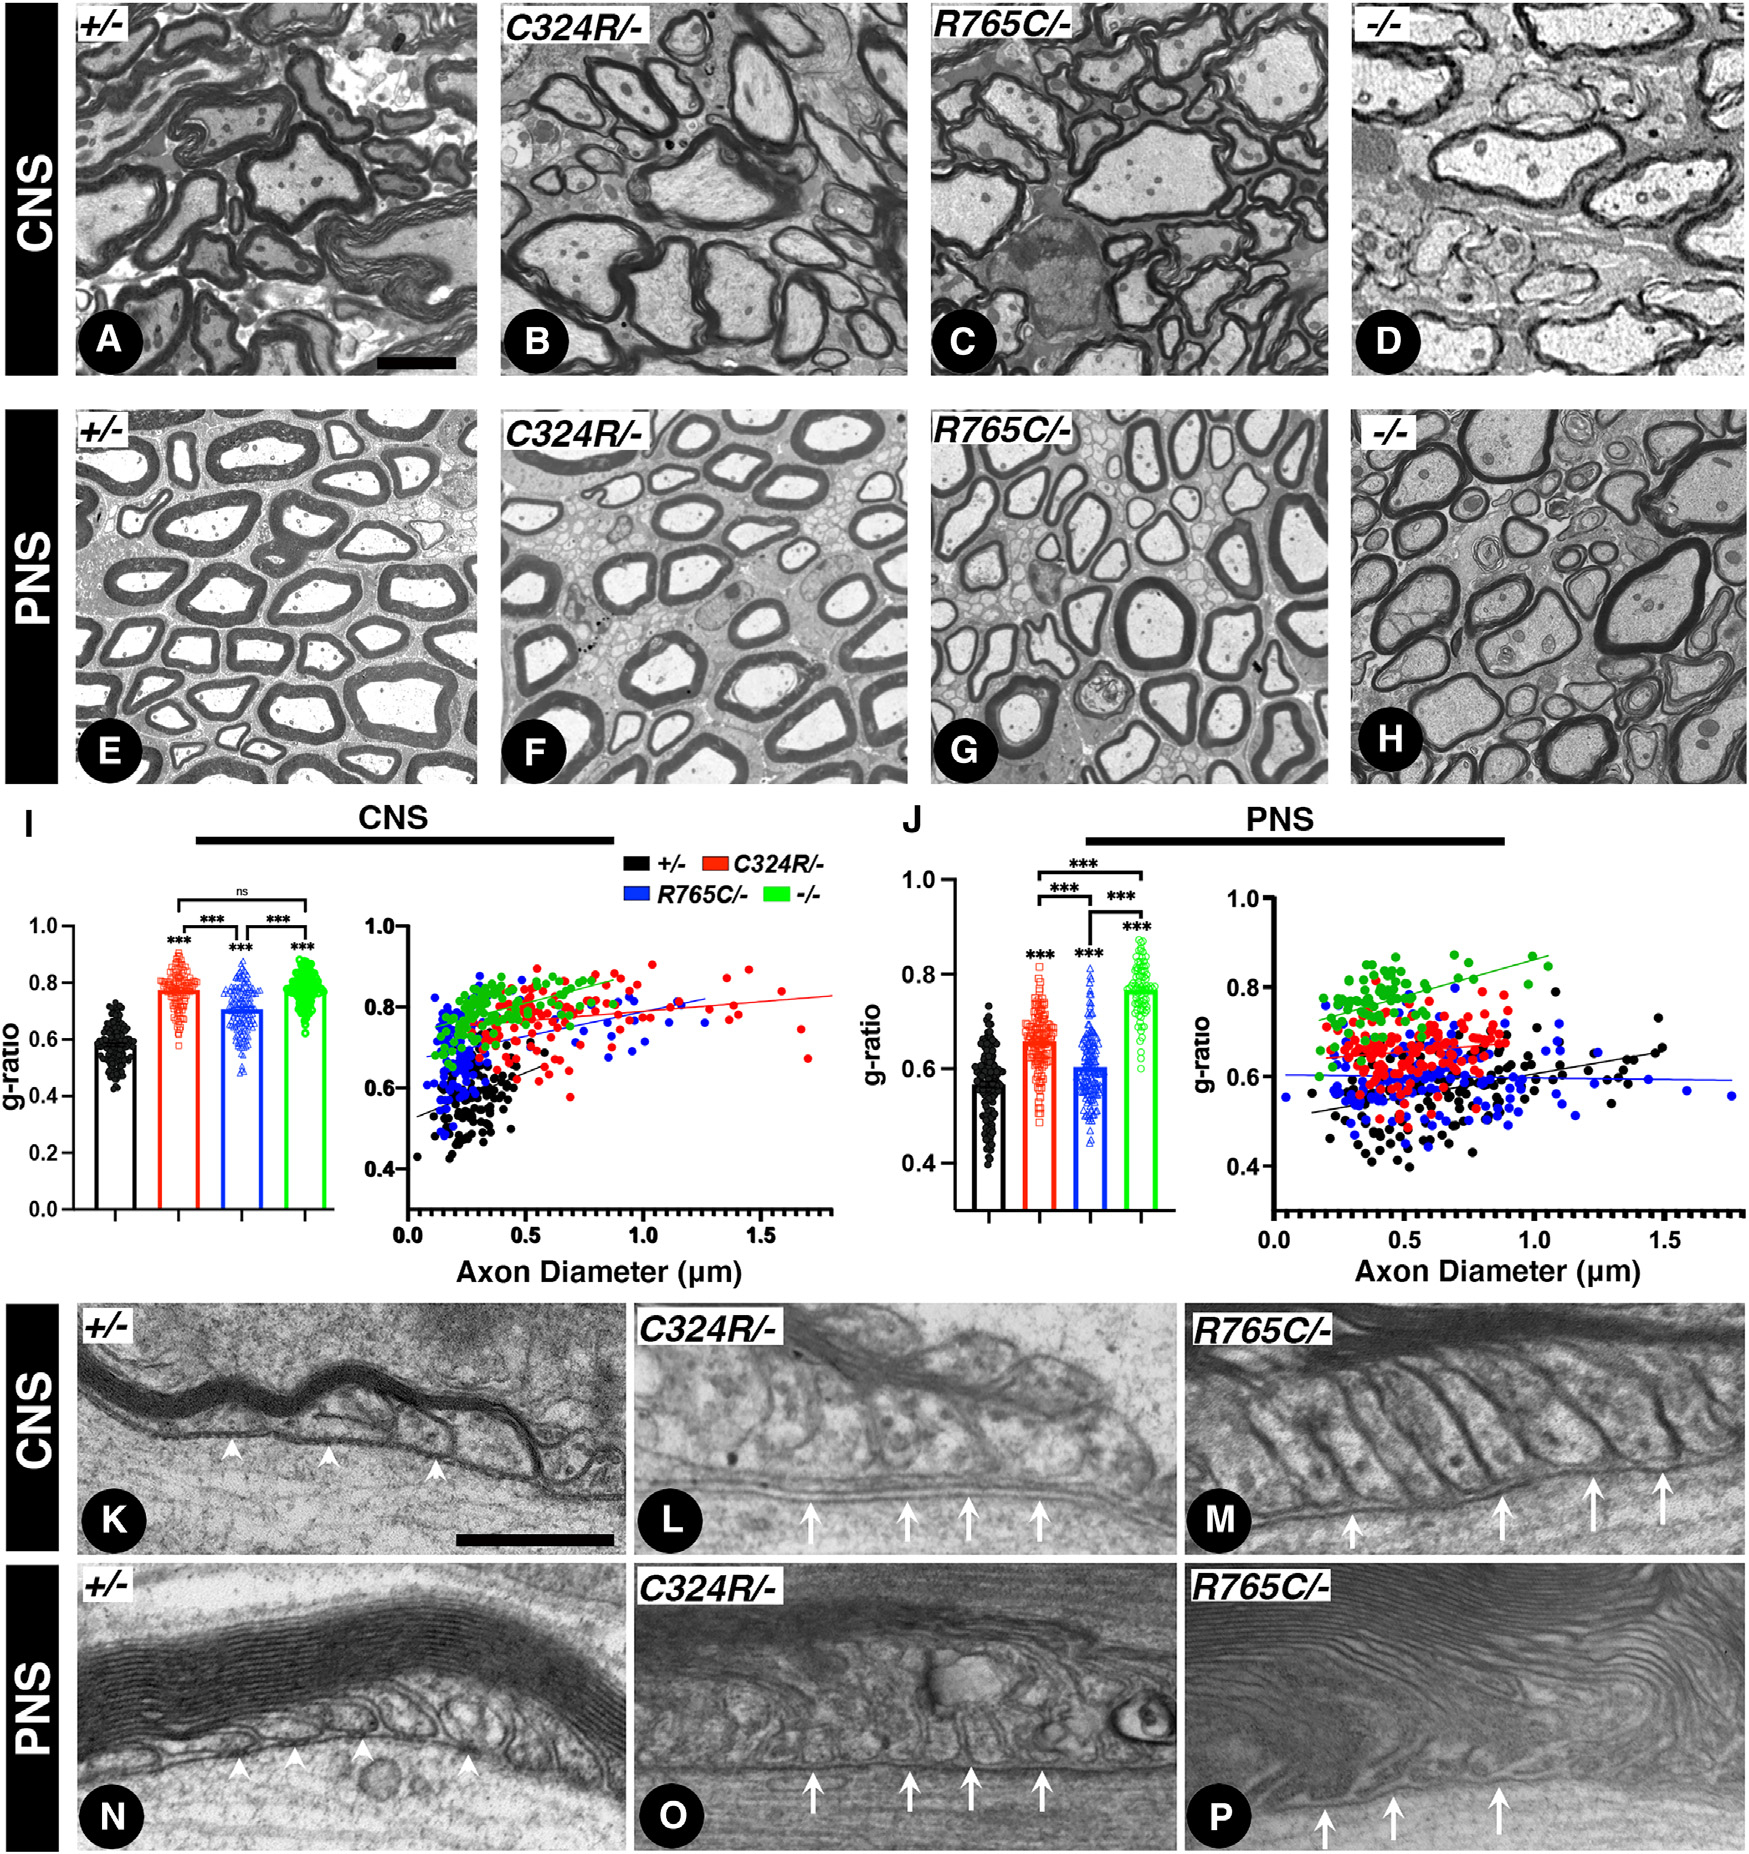
Figure 3. Cntnap1C324R/− and Cntnap1R765C/− mutants display hypomyelination and loss of the paranodal axo-glial junctions.

(A–D) Transmission electron microscopy (TEM) images of cross-sections from P21 spinal cords.
(E–H) TEM of cross-sections from P21 sciatic nerves.
(I and J) Morphometric analysis measuring the g-ratios of myelinated axons (I, spinal cords; J, sciatic nerves).
(K–M) TEM images of longitudinal sections of P21 spinal cords at the level of the paranodal region showing axo-glial junctions.
(N–P) TEM images of longitudinal sections of P21 sciatic nerves. White arrowheads in (K) and (N) indicate distinct ladder-like septate junctions between myelin loops. White arrows in (L), (M), (O), and (P) indicate lack of axo-glial septate junctions in the CNS and PNS myelinated axons. Scale bars: 2 μm (A–H) and 0.2 μm (K–P). Data are represented as the mean ± SEM of three biological replicates.
