
Figure 4. Neuronal expression of the wild-type Cntnap1 gene progressively restores axonal domain organization in Cntnap1C324R/− and Cntnap1R765C/− mutant myelinated axons.
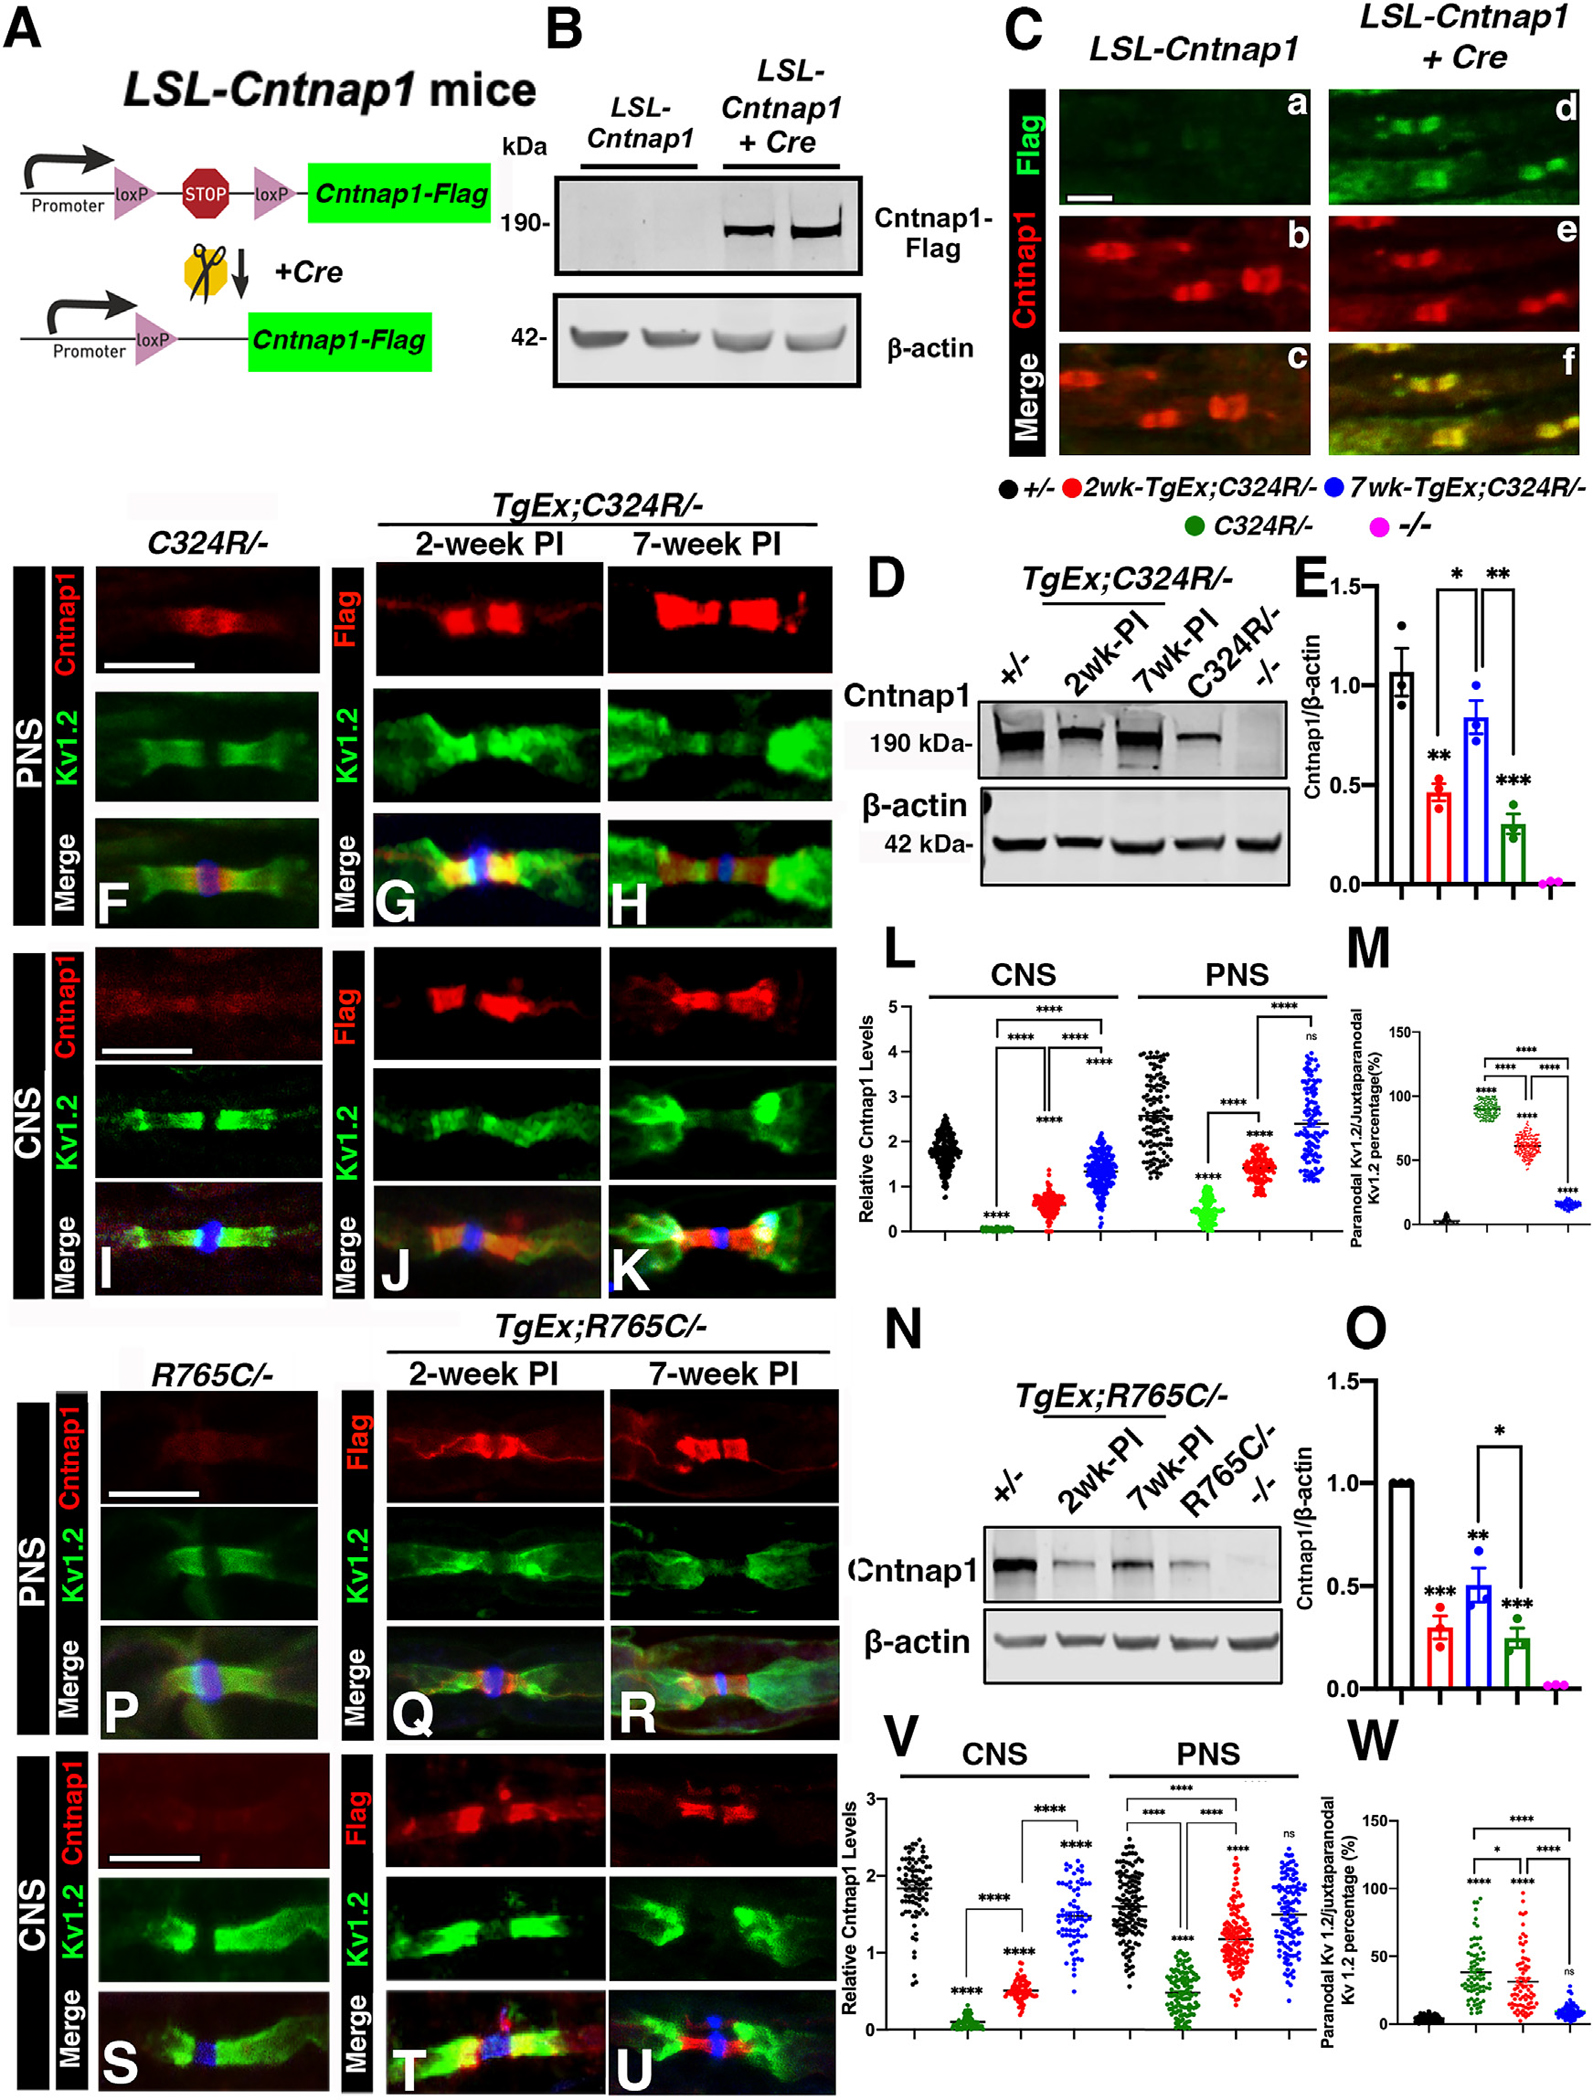
(A) Schematic representation of the generation of LoxP-Stop-LoxP (LSL) Cntnap1FLAG transgenic mice.
(B) Representative immunoblots showing expression of FLAG-tagged Cntnap1 (Cntnap1FLAG) in the spinal cords. β-actin was used as a loading control.
(C) Immunostaining of sciatic nerves. Scale bar: 10 μm.
(D and E) Representative immunoblots showing expression of Cntnap1FLAG in spinal cord tissues at 2 or 7 weeks after tamoxifen injection. β-actin was used as loading control. The relative protein intensities are quantified in (E).
(F–K) Immunostaining of sciatic nerves (F–H) or spinal cords (I–K) from TgEx;C324R/− mice at 2 weeks (G, J) or 7 weeks (H, K) after tamoxifen injection. Scale bar: 5 μm.
(L and M) The relative fluorescence quantification of Cntnap1 in both the CNS and PNS.
(N and O) Representative immunoblots showing the expression of Cntnap1FLAG in the spinal cords from TgEx;R765C/− mice at 2 or 7 weeks after tamoxifen injection. The relative protein intensities of Cntnap1 are quantified in (O).
(P–U) Immunostaining of sciatic nerves (P–R) or spinal cords (S–U) from TgEx;R765C/− mice at 2 weeks (Q, T) or 7 weeks (R, U) after tamoxifen injection. Scale bar: 5 μm.
(V and W) The relative fluorescence quantification of Cntnap1 in both the CNS and PNS. Data are represented as the mean ± SEM of three to six biological replicates.