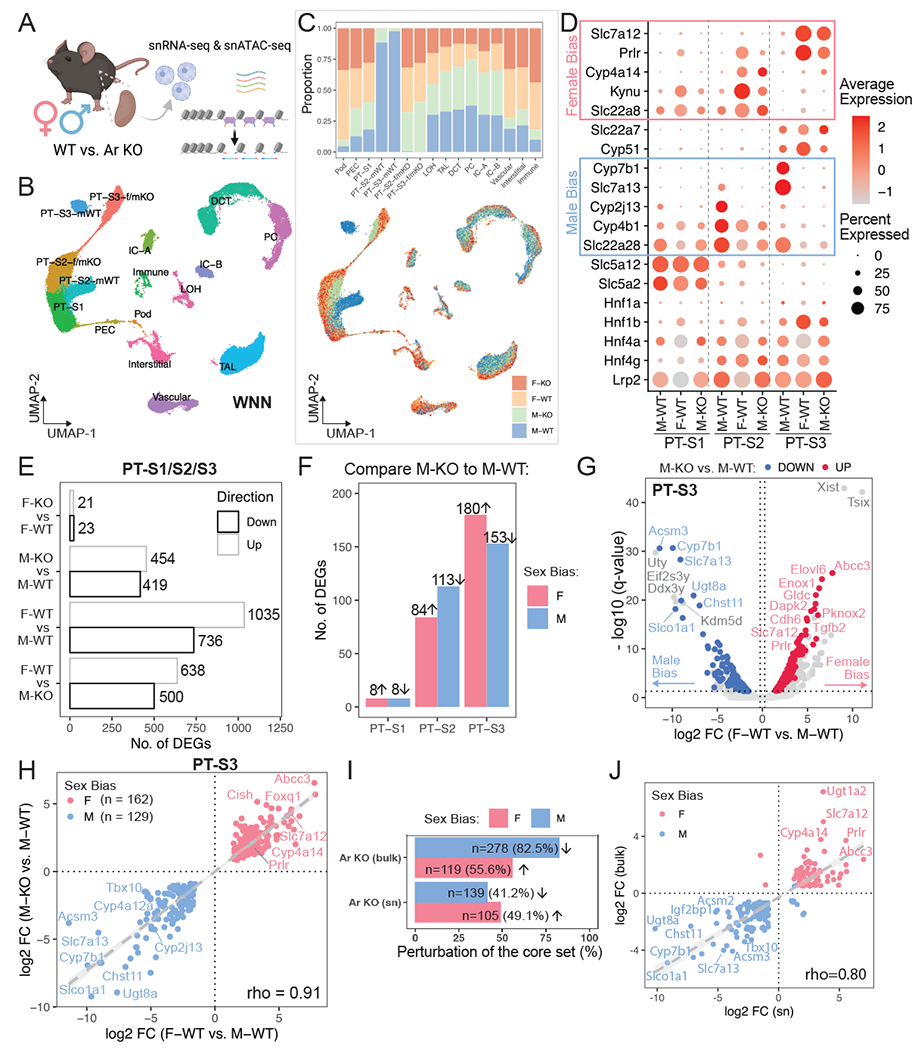
Figure 4. Single-nuclear multiomic profiling of AR function in the mammalian kidney.

(A) Schematic summary of the single-nuclear multiomic experiment. Created with BioRender.com.
(B) UMAP plot indicates the divergent features between male and female PT cells while the other cell populations co-cluster regardless of sex. Nuclei were clustered based on RNA and ATAC modalities using weighted nearest neighbor (WNN) graph.
(C) Distribution of sex and genotype among all cell populations shown in (B). Top: stacked bar plot shows composition in each cluster; bottom: nuclei in the UMAP plot (B) colored by different sex-genotype combinations.
(D) Dot plot demonstrates the expression pattern of top marker genes for individual PT segments. Known sex-biased genes are indicated.
(E) Bar plot shows the total number of differentially expressed genes identified using the multiomic RNA data by four pairwise comparisons within PT segments.
(F) Bar plot lists segment-wise number of single-nuclear sex-biased genes that were perturbed upon AR removal.
(G) Volcano plot shows single-nuclear sex-biased genes identified in PT-S3 segment, where genes that are perturbed by AR removal in the male kidney are highlighted.
(H) Scatter plot contrasts the effect of nephron-specific AR removal in male to the observed sex biases.
(I) Bar plot compares the percentage of the core sex-biased genes that were perturbed by nephron-specific AR removal, between bulk and single-nuclear RNA-seq.
(J) Scatter plot shows the impact of nephron-specific AR removal on common sex-biased gene, using bulk or single-nuclear RNA-seq data.
