
Figure 6. Fluorescence RNA in situ hybridization by RNAscope validates dimorphic gene expression in proximal tubule.
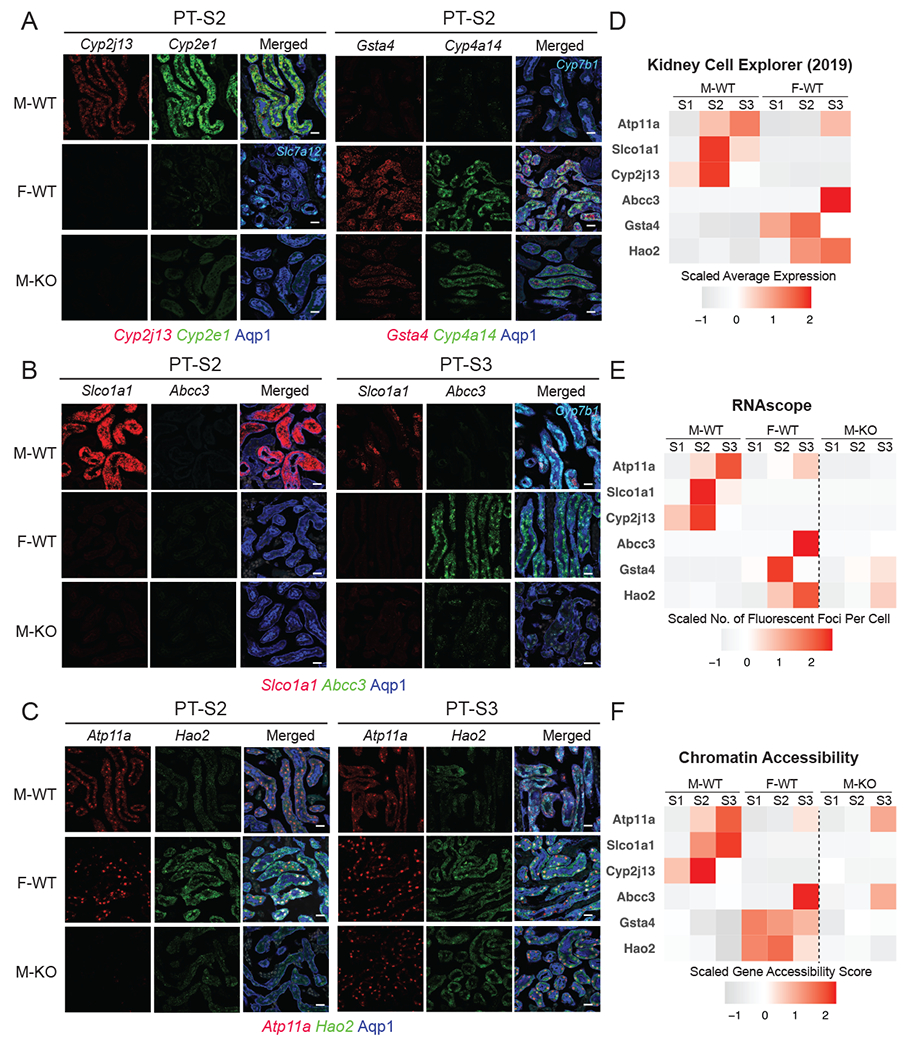
(A-C) RNAscope assay directly visualized the expression levels of sex-biased genes in M-WT, F-WT, and M-KO PT-S2 & S3 (scale bars = 20 μm): co-stained with an antibody against Aqp1 (blue) demarcating the PT.
(A) Left: Cyp2j13 (red) and Cyp2e1 (green, male PTS2 marker) co-stained with Slc7a12 (Cyan, female PTS3 marker); right: Gsta4 (red) and Cyp4a14 (green, female PTS2 marker) co-stained with Cyp7b1 (Cyan, male PTS3 marker).
(B) Slco1a1 (red) and Abcc3 (green), co-stained with Cyp7b1 (Cyan, male PTS3 marker)
(C) Atp11a (red) and Hao2 (green).
(D-F) Tile maps show the expression and chromatin profile of top sex-biased genes in M-WT and F-WT PT segments: (D) data from previous scRNA-seq experiment19; (E) in-situ expression of top sex-biased genes measured by RNAscope; and (F) the estimated chromatin accessibility.