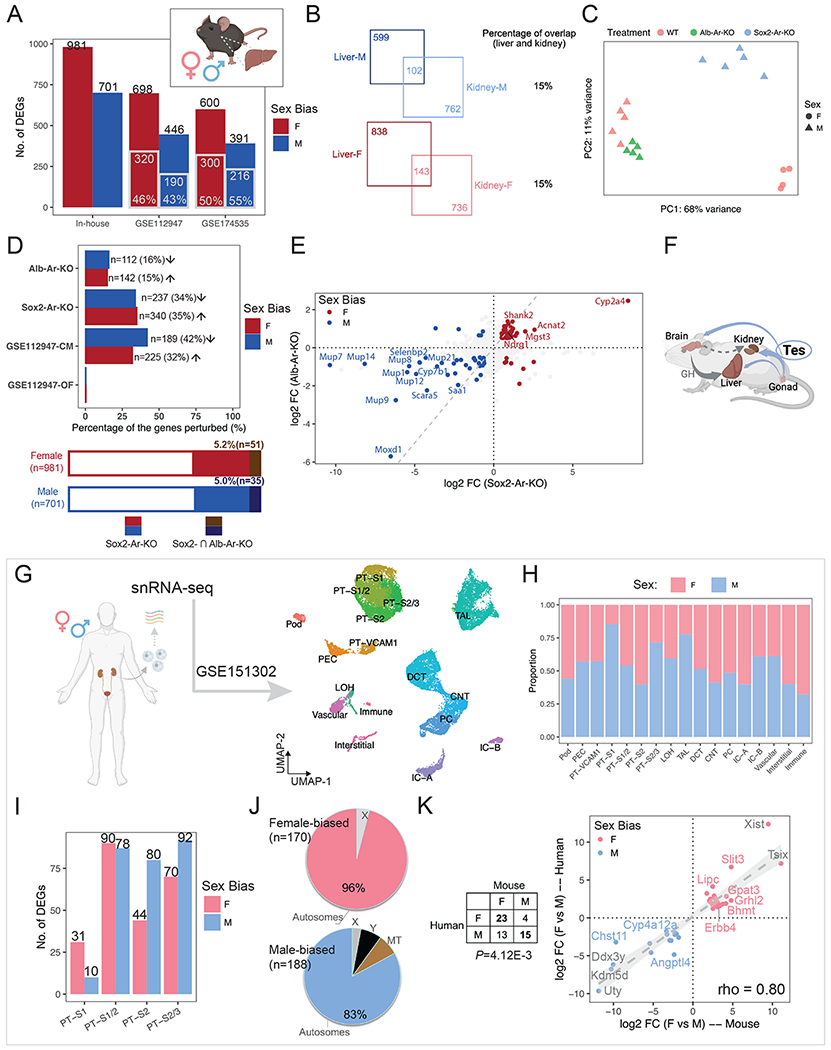
Figure 7. Distinct and shared processes of dimorphic gene expression between organs and species.

(A) Bar plot shows the number of liver sex-biased genes identified in the current study (in-house) and those reported in the literature. Gray-contoured bars indicate the number of genes overlapping with the in-house list.
(B) Venn diagrams show the number of sex-biased genes that are shared in the kidney and liver.
(C) PCA plot demonstrates the impact of hepatocyte-specific (Alb-Ar-KO) and systemic AR removal (Sox2-Ar-KO), as compared to WT samples.
(D) The percentage of in-house liver sex-biased genes that were perturbed in individual treatments is shown in the bar plot (top) and stacked bar plot (bottom). Arrows indicate the direction of perturbation in gene expression when compared to controls.
(E) Scatter plots compare the changes in expression of in-house liver sex-biased genes between systemic and hepatocyte-specific Ar removal. The dashed gray diagonal line marks equal impact.
(F) A schematic summary of how testosterone influences the sexual dimorphism in the kidney and liver. Created with BioRender.com.
(G) UMAP plot shows clustering of human renal snRNA-seq data (GSE151302).
(H) Composition of male and female cells in each cluster in (B).
(I) Bar plot shows the number of sex-biased genes among each PT cluster in (B).
(J) Pie charts demonstrates the percentage of autosomal versus X/Y-linked genes among all the sex-biased genes identified in (D).
(K) Comparison of sex-biased gene expression in human and mouse kidney reveals conserved sexual dimorphism. The table lists the number of orthologs that show sex biases in gene expression; the scatter plot shows the differences in expression of common sex-biased genes in human and mouse PT segments.
