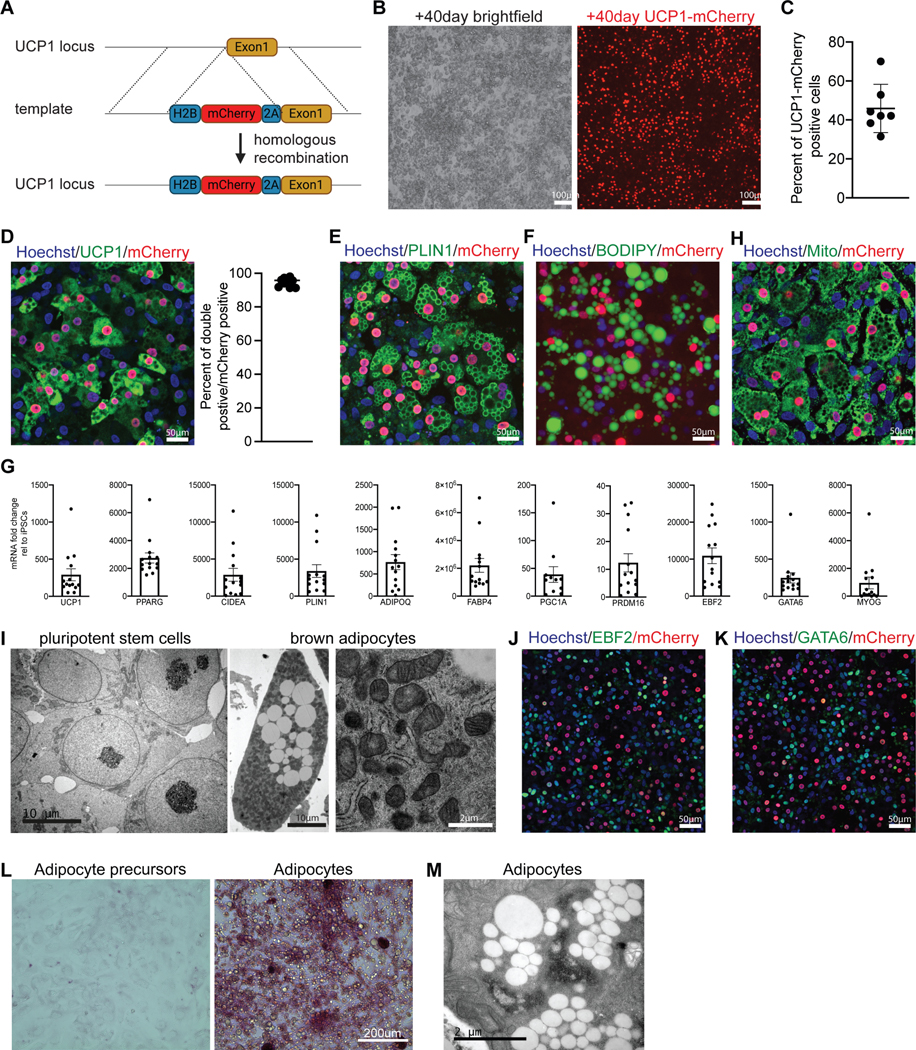
Figure 5 -. Differentiation of human mature BA in vitro.

A – Targeting strategy used to generate UCP1-mCherry hiPSC line.
B – Brightfield and mCherry signal in iPSC-BA cultures on d60, n≥20.
C – Quantification of mCherry-positive cells in iPSC-BA cultures on d60. Mean ± SD, n=7.
D– Immunofluorescence staining with UCP1 and mCherry antibodies in the UCP1-mCherry knock-in iPSC-BA cultures on d60. Fraction of UCP1 and mCherry double positive cells from all mCherry-positive cells. n=10.
E– Immunofluorescence staining for PLIN1 antibody in the UCP1-mCherry knock-in iPSC-BA cultures on d60. n=6.
F – Neutral lipid staining using 0.5mM BODIPY in iPSC-BA cultures on d60, n=3.
G – RT-qPCR analysis of iPSC-BA cultures on d60. Mean ± SD, n=11–14.
H – Immunofluorescence staining for mitochondria on iPSC-BA cultures on d60, n=5.
I – Representative transmission electron micrographs of hiPSCs (left) and iPSC-BA (middle and right), n=3.
J–K – Immunofluorescence staining with antibodies against EBF2 (O), GATA6 (P) in UCP1mCherry iPSC-BA cultures on d60, n=4.
L – Periodic Acid staining on BA precursors (d20) and BAs (d60), n=3.
M – Transmission electron microscopy micrographs demonstrating glycogen accumulation in iPSC-BA, n=3.
See also Figure S5.
