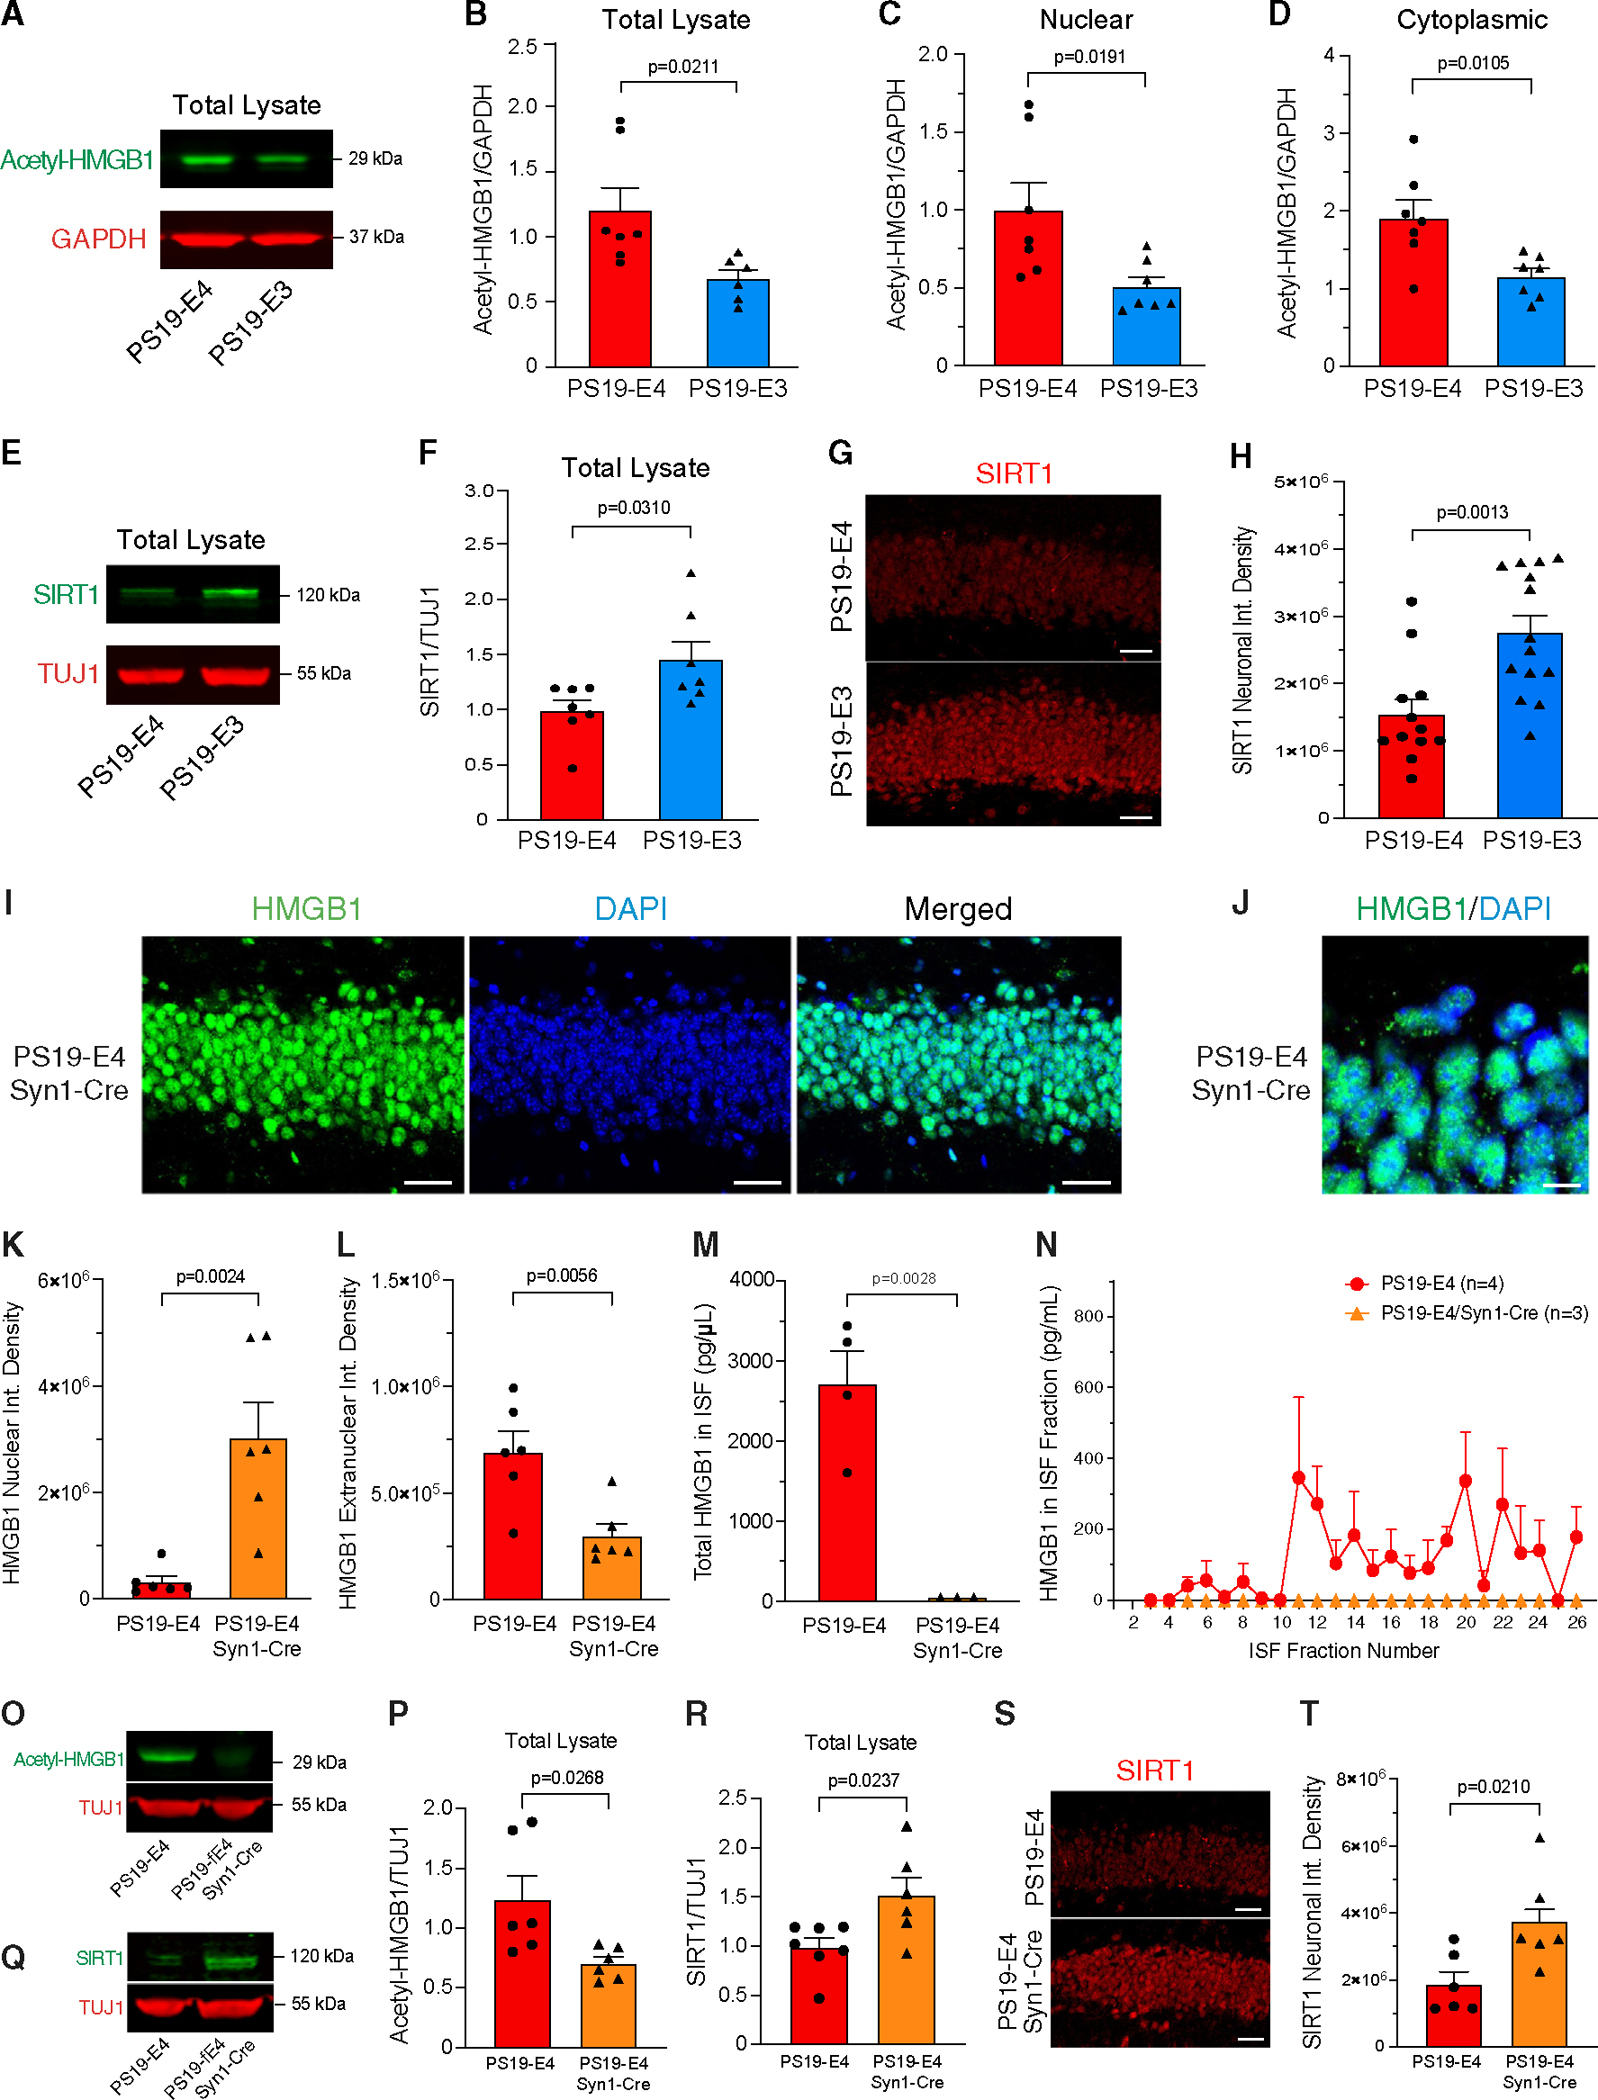
Figure 3. APOE4 promotes acetylation of HMGB1 and decreases levels of SIRT1 deacetylase, and removal of neuronal APOE4 reduces HMGB1 acetylation and increases SIRT1 levels.

(A) Representative images of anti-acetyl-HMGB1 (green) and anti-GAPDH (red) western blots in hippocampal tissue lysates.
(B) Quantification of acetyl-HMGB1 levels relative to GAPDH.
(C and D) Quantification of acetyl-HMGB1 levels relative to GAPDH in the nuclear fraction (C) and cytoplasmic fraction (D).
(E) Representative images of anti-SIRT1 (green) and anti-TUJ1 (red) western blots in hippocampal tissue lysates.
(F) Quantification of SIRT1 levels relative to TUJ1.
(G) Representative images of neurons stained with anti-SIRT1 in the hippocampus (scale bar, 60 μm).
(H) Quantification of the integrated density of SIRT1 in hippocampal neurons.
(I) Representative images of immunostaining with anti-HMGB1 and DAPI in hippocampal neurons (scale bar, 40 μm).
(J) Representative high-magnification images of immunostaining with anti-HMGB1 and DAPI in hippocampal neurons (scale bar, 10 μm).
(K and L) Quantification of the nuclear integrated density (K) and extranuclear integrated density (L) of HMGB1 immunostaining in hippocampal neurons.
(M and N) HMGB1 protein levels measured by ELISA in all hippocampal interstitial fluid (ISF) fractions (M) and in each collected ISF fraction (N).
(O) Representative images of anti-acetyl-HMGB1 (green) and anti-TUJ1 (red) western blots in hippocampal tissue lysates.
(P) Quantification of acetyl-HMGB1 levels relative to TUJ1.
(Q) Representative images of anti-SIRT1 (green) and anti-TUJ1 (red) western blots in hippocampal tissue lysates.
(R) Quantification of SIRT1 levels relative to TUJ1.
(S) Representative images of neurons stained with anti-SIRT1 in hippocampus (scale bar, 60 μm).
(T) Quantification of the integrated density of SIRT1 in hippocampal neurons.
Data in (B), (C), (D), (F), (P), and (R) are quantified by western blot analysis of hippocampal tissue lysates. For all representative images and quantified data, mice were 10 months of age and belonged to PS19-E4, PS19-E3, or PS19-E4/Syn1-Cre group as indicated. Quantified data in (B), (C), (D), and (F) (PS19-E4, n = 7; PS19-E3, n = 7); in (H) (PS19-E4, n = 12; PS19-E3, n = 14); and in (K), (L), (P), (R), and (T) (PS19-E4, n = 6; PS19-E4/Syn1-Cre, n = 6) are represented as the mean ± SEM, unpaired two-tailed t test. Fractions 1 and 2 were excluded from analyses in (O) and (P). Quantified data in (M) and (N) (PS19-E4, n = 4; PS19-E4/Syn1-Cre, n = 3) are represented as the mean ± SEM, unpaired two-tailed t test.
