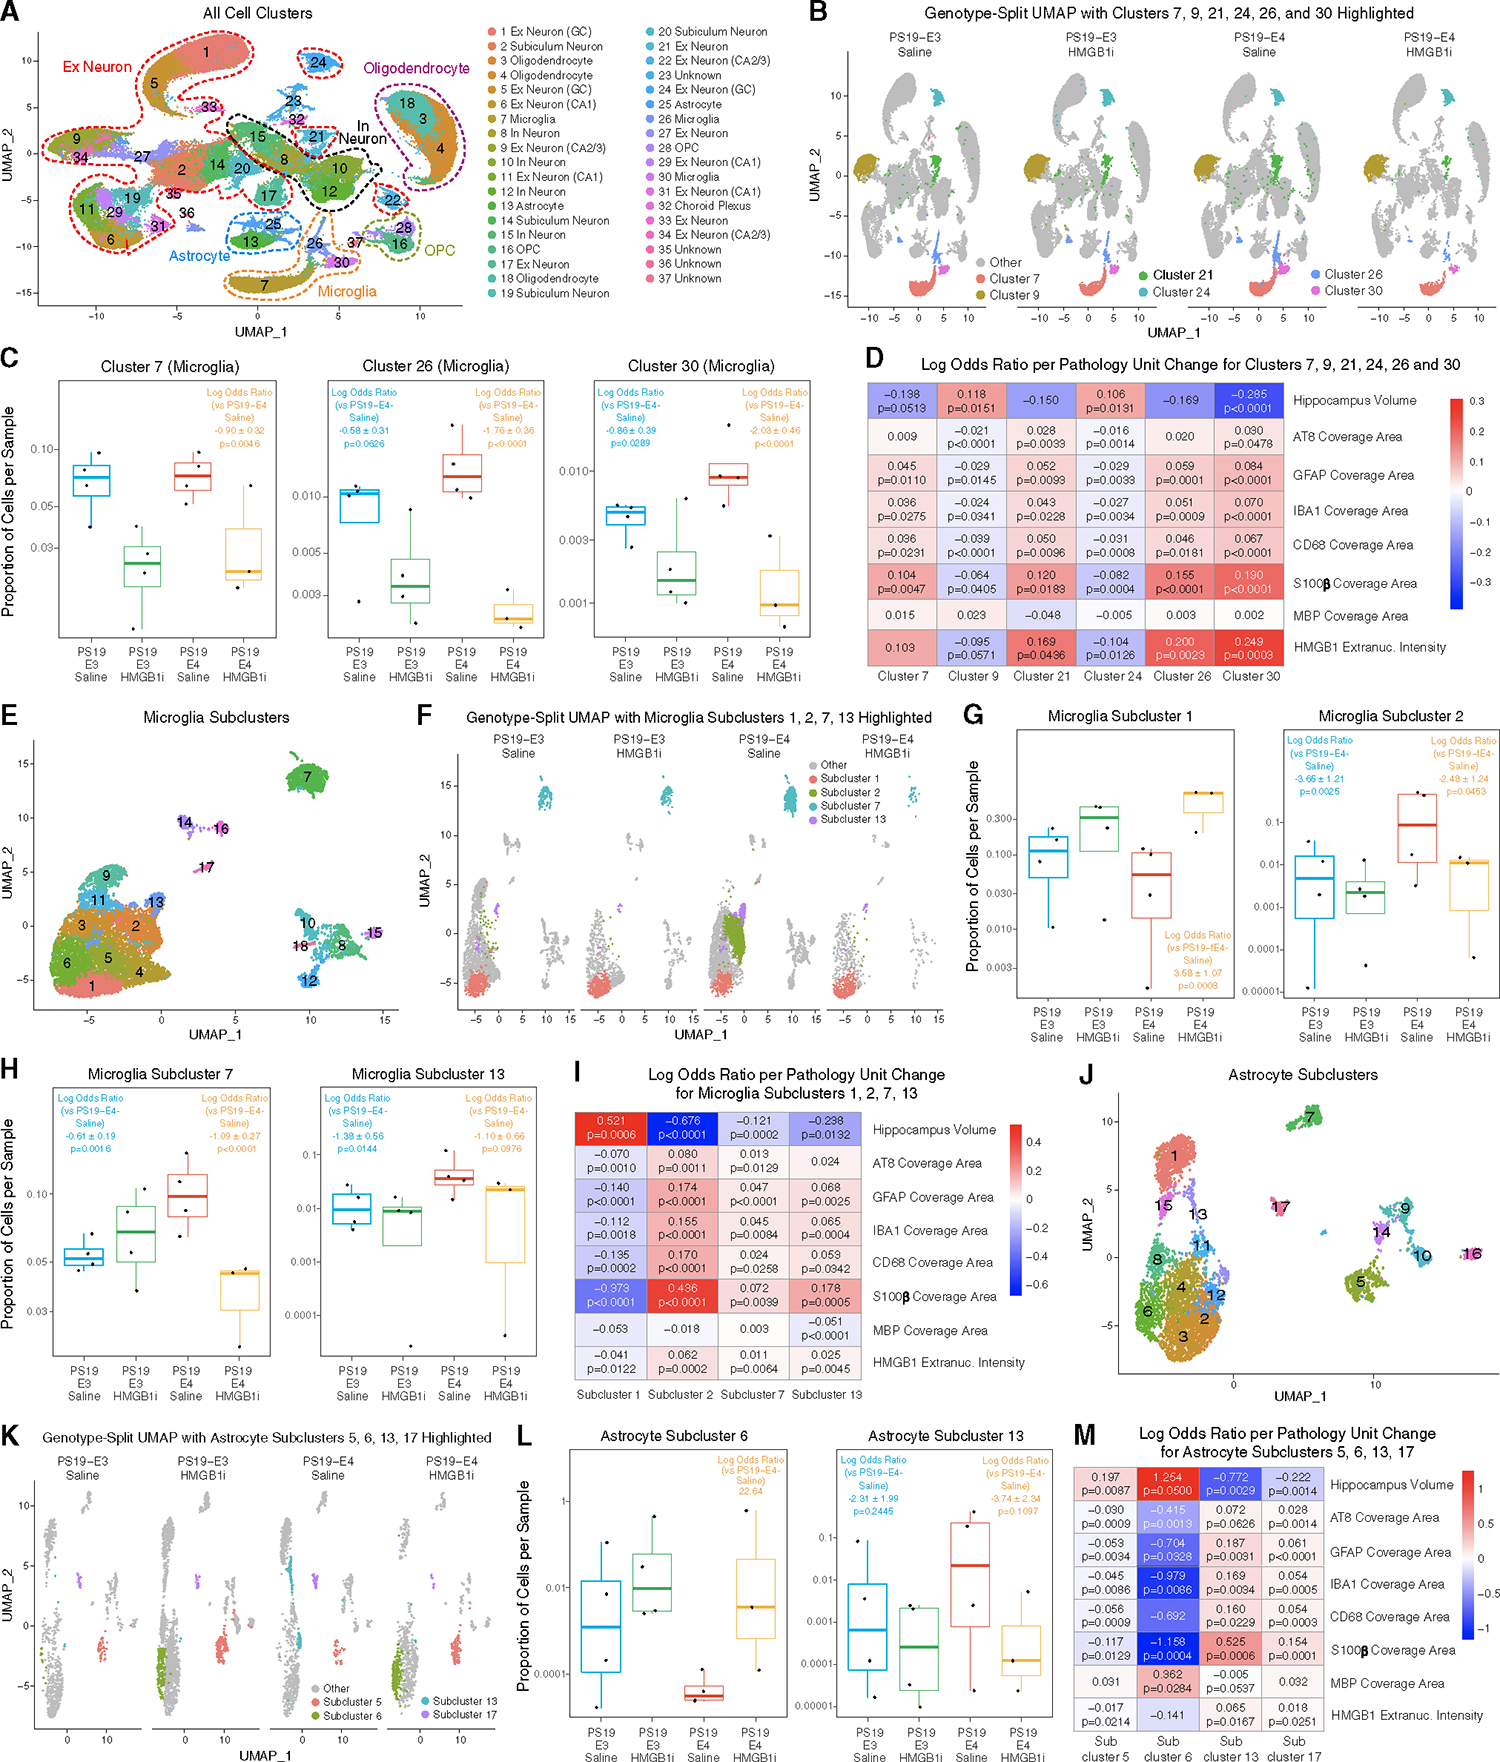
Figure 7. Long-term treatment of PS19-E4 mice with HMGB1 inhibitors diminishes disease-associated and enriches disease-protective subpopulations of microglia and astrocytes.

(A) UMAP plot of all 37 distinct cell clusters in the isolated hippocampi of 9.5-month-old PS19-E4 mice treated with saline (n = 4) or HMGB1 inhibitors (n = 3) and PS19-E3 mice treated with saline (n = 4) or HMGB1 inhibitors (n = 4).
(B) UMAP plot highlighting cells in hippocampal cell clusters 7, 26, and 30 (microglia) and clusters 9, 21, and 24 (excitatory neurons).
(C) Boxplot of the proportion of cells from each sample in microglia clusters 7, 26, and 30.
(D) Heatmap plot of the log odds ratio per unit change in each pathological parameter for hippocampal cell clusters 7, 9, 21, 24, 26, and 30.
(E) UMAP plot of 18 microglial subclusters after subclustering hippocampal cell clusters 7, 26, and 30.
(F) UMAP plot highlighting cells in microglial subclusters 1, 2, 7, and 13.
(G) Boxplot of the proportion of cells from each sample in microglia subclusters 1 and 2.
(H) Boxplot of the proportion of cells from each sample in microglia subclusters 7 and 13.
(I) Heatmap plot of the log odds ratio per unit change in each pathological parameter for microglial subclusters 1, 2, 13, and 17.
(J) UMAP plot of 17 astrocyte subclusters after subclustering hippocampal cell clusters 13 and 25.
(K) UMAP plot highlighting cells in astrocyte subclusters 5, 6, 13, and 17.
(L) Boxplot of the proportion of cells from each sample in astrocyte subclusters 6 and 13. There are no cells from PS19-E4 mice in astrocyte subcluster 6, so statistical significance and standard error are not reported.
(M) Heatmap plot of the log odds ratio per unit change in each pathological parameter for astrocyte subclusters 5, 6, 13, and 17.
For (C), (G), (H), and (L), the log odds ratios are presented as the mean ± SEM. For heatmap plots in (D), (I), and (M), negative associations are shown in blue and positive associations are shown in red. The p values in (C), (G), (H), and (L) are from fits to a GLMM_AM model, and the p values in (D) are unadjusted from fits to a GLMM_histopathology model (see Tables S3, S5, and S7 and STAR Methods for details). All error bars represent the standard error. Ex Neuron, excitatory neuron; In Neuron, inhibitory neuron; OPC, oligodendrocyte progenitor cell. For details, also see Tables S2–S7.
