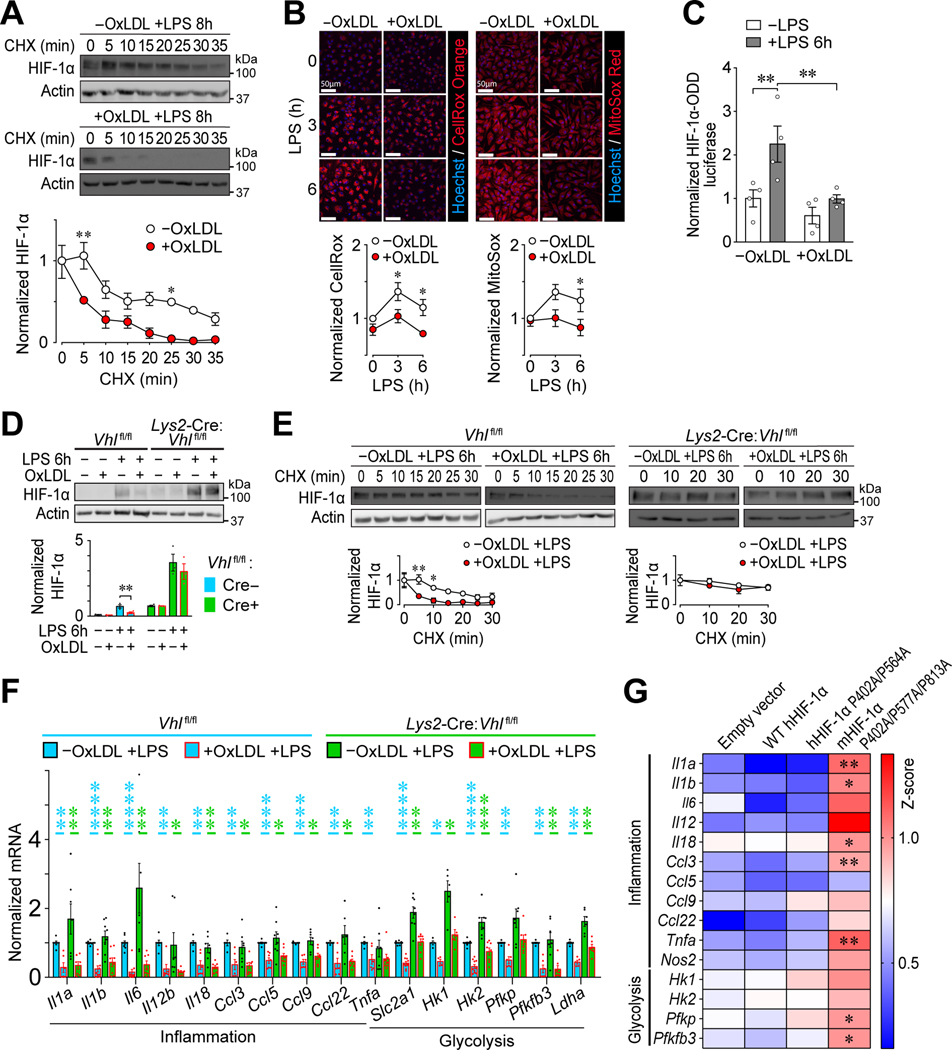
Figure 3: OxLDL accumulation in Mφs impairs LPS-induced inflammation by reducing HIF-1α stability and transactivation capacity.
(A) Effect of oxLDL accumulation on HIF-1α stability in LPS-stimulated (8 h) PMφs. Representative immunoblots showing a time course after CHX treatment and quantification. Values are normalized to corresponding actin and the pre-CHX time point (assigned a value of 1, n=3). (B) Effect of oxLDL loading on ROS in LPS-stimulated PMφs. Representative images and quantification of total ROS (CellRox Orange, Orange, n=5) and mitochondrial ROS (MitoSox, red, n=5). Data are normalized to the 0 h LPS time point of PMφs without oxLDL. (C) Effect of LPS stimulation (6 h) on PHD activity in RAW264.7 cells transfected with luciferase reporters. HIF-1α-ODD firefly luciferase activity is normalized to Renilla luciferase activity to account for transfection efficiency and to values found in control cells (n=4). (D) Assessment of HIF-1α abundance in unstimulated and LPS-stimulated (6 h) VHL-deficient (Lys2-Cre:Vhlfl/fl) and WT control (Vhlfl/fl) BMDMφs. Representative immunoblots and quantification are shown. Values are normalized to actin (n=3; unpaired Student’s t-test). (E) Assessment of HIF-1α stability in LPS-stimulated (6 h) VHL-deficient (Lys2-Cre:Vhlfl/fl) and WT control (Vhlfl/fl) BMDMφs. Representative immunoblots and quantification are shown. Values are normalized to actin and the first time point of CHX treatment (n=3–4). (F) Suppression of inflammatory and glycolysis gene mRNA expression by oxLDL accumulation in LPS-stimulated (6 h) Vhlfl/fl vs. Lys2-Cre:Vhlfl/fl BMDMφs analyzed by qPCR. Data were normalized to Vhlfl/fl cells without oxLDL (assigned a value of 1). Statistical comparisons using the Mann-Whitney U Test were within each genotype (p values are blue for Vhlfl/fl and green for Lys2-Cre:Vhlfl/fl, n=3–10 for each group). (G) Effect of HIF-1α mutations on proinflammatory and glycolysis gene mRNA expression in LPS-stimulated (6 h) stable transfected RAW264.7 cell lines. The effect of cholesterol accumulation was assessed for each cell line and all cell lines were compared to the empty vector line. Heat map z scores of qPCR data are plotted (n=3–9 per group, one-way ANOVA with Bonferroni correction). A higher score represents reduced inhibition of mRNA expression by cholesterol. In all graphs, the mean ± SEM is plotted. Unless indicated otherwise, statistical significance was determined by two-way ANOVA with Bonferroni correction (*P<0.05, **P<0.01, ***P<0.001, ****P<0.0001).

