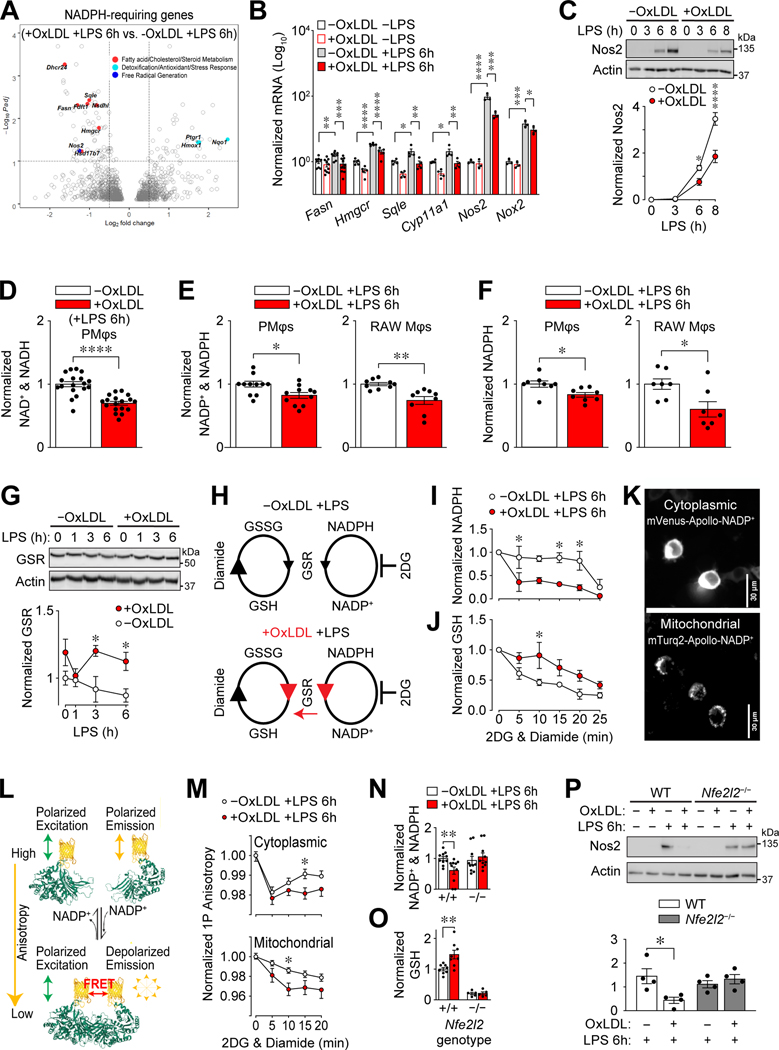
Figure 6: Altered NADPH metabolism in Mφs with accumulated oxLDL is Nrf2-dependent.
(A) OxLDL accumulation induces differential expression of NADPH-requiring enzymes in LPS-stimulated (6 h) PMφs. A volcano plot shows differentially expressed genes (identified using DESeq2, n=3). NADPH-requiring enzymes are indicated as filled circles, each color corresponding to a different pathway (indicated). (B) Effect of oxLDL accumulation in PMφ and LPS stimulation (6 h) on mRNA expression of NADPH-requiring enzymes. For each gene, values were determined by qPCR and normalized to PMφs without oxLDL and LPS (assigned a value of 100, n=3–8). (C) Effect of oxLDL accumulation on LPS-induced Nos2 protein in PMφs. Representative immunoblots showing a time course after LPS stimulation and quantification (Nos2 values are normalized to actin, n=3). (D-F) Effect of oxLDL accumulation on metabolites in LPS-stimulated (6 h) Mφs. (D) LC-MS analysis of total NAD+ and NADH in PMφs (n=18), (E) assay of NADP+ and NADPH in PMφs (n=11) and RAW264.7 cells (n=9), and (F) assay of total NADPH in PMφs (n=8) and RAW264.7 cells (n=7). Values were normalized to the corresponding -oxLDL group (assigned a value of 1). (G) Effect of oxLDL accumulation on Glutathione-disulfide reductase (GSR) protein in LPS-stimulated RAW264.7 cells. A representative immunoblot shows a time course after LPS stimulation. GSR values were quantified and normalized to actin and the -oxLDL, 0 h LPS group (assigned a value of 1, n=4). (H-J) Assessment of GSR activity by measuring the rate of NADPH consumption. (H) Schematic illustrating conversion of glutathione disulfide (GSSG) to glutathione (GSH) by GSR and its cofactor NADPH. Diamide drives this reaction by converting GSH to GSSG, and 2DG blocks NADPH replenishment. Anticipated effects of oxLDL accumulation are shown in red. (I, J) Effect of oxLDL accumulation on the rate of NADPH consumption (I) and GSH production (J) in LPS-stimulated (6 h) RAW264.7 cells. Data are normalized to the 0 min time point i.e., just prior to diamide and 2DG addition (assigned a value of 1, n=3 for -oxLDL and +oxLDL groups). (K) Representative images of stable-transfected RAW264.7 cells expressing cytoplasmic mVenus-Apollo-NADP+ (top) and mitochondrial mTurq2-Apollo-NADP+ (bottom) sensors. (L) Schematic of the Apollo-NADP+ sensor, comprised of enzymatically inactivated human G6PD tagged with fluorescent protein, which responds to free NADP+ through allosteric dimerization. (M) 1P anisotropy quantification using stable-transfected RAW264.7 cells. Anisotropy values are normalized to the 0 min time point (assigned a value of 1, n=3). (N, O) Effect of oxLDL accumulation on the total NADP+ and NADPH (N) and GSH (O) in LPS-stimulated (6h) Nfe2l2+/+ (WT) and Nfe2l2−/− BMDMφs. Data are normalized to WT cells without oxLDL (assigned a value of 1). Comparisons within each genotype using the Mann-Whitney U test for NADP+ and NADPH (n=6–7) and unpaired Student’s t-test for GSH (n=5–8). (P) OxLDL accumulation suppresses LPS-inducible Nos2 protein in WT, but not Nfe2l2−/−, BMDMφs. Representative immunoblots and quantification (Nos2 values are normalized to actin; n=4, comparisons within each genotype using an unpaired Student’s t-test). Nos2 was not detected in cells without LPS stimulation (6h) and this condition was omitted from the graphs. The mean ± SEM is plotted in all graphs. Unless indicated otherwise, statistical significance was determined by a two-way ANOVA with Bonferroni correction (*P<0.05, **P<0.01, ***P<0.001, ****P<0.0001).

