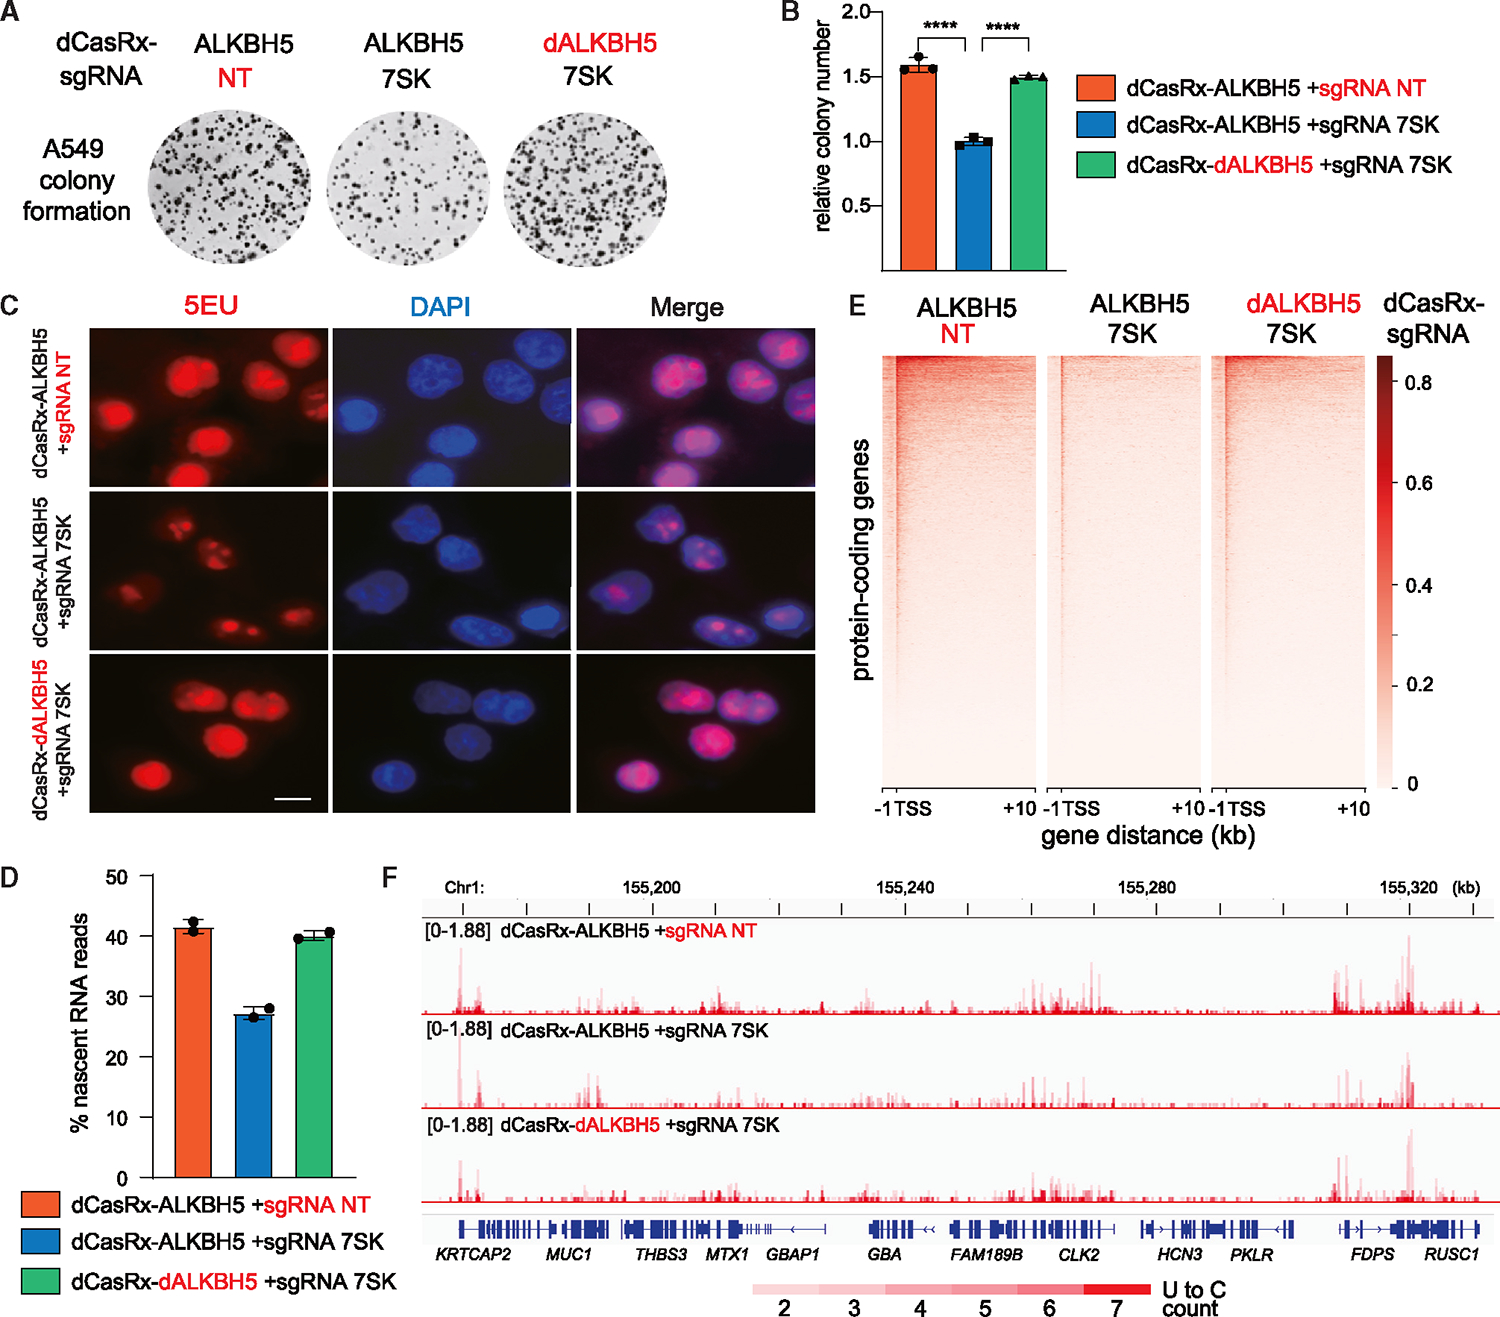
Figure 5. Reducing m6A-7SK inhibits NSCLC cell colony formation and RNA Pol II transcription.

Experiments were performed in the engineered A549 cell lines stably expressing fusion dCasRx-ALKBH5 against 7SK, and two control cell lines as in Figure 4. (A and B) Representative image (A) and relative colony number (B) in colony formation assays (error bars represent SD; t test calculated the p value, ****p < 0.0001).
(C) EU incorporation and staining of nascent RNAs. Scale bars, 10 μm.
(D) Histogram profile showing the percentage of mapped nascent reads that contain 2–7 U-C mutations from duplicate nascent RNA sequencing (RNA-seq) experiments.
(E) Heatmap distribution of nascent RNA reads mapped to protein-coding genes, centered at the TSS (−1 kb to +10 kb).
(F) Genome browser shots of nascent RNA-seq tracks, spanning 155,160–155,330 kb of chromosome 1. See also Figure S5.
