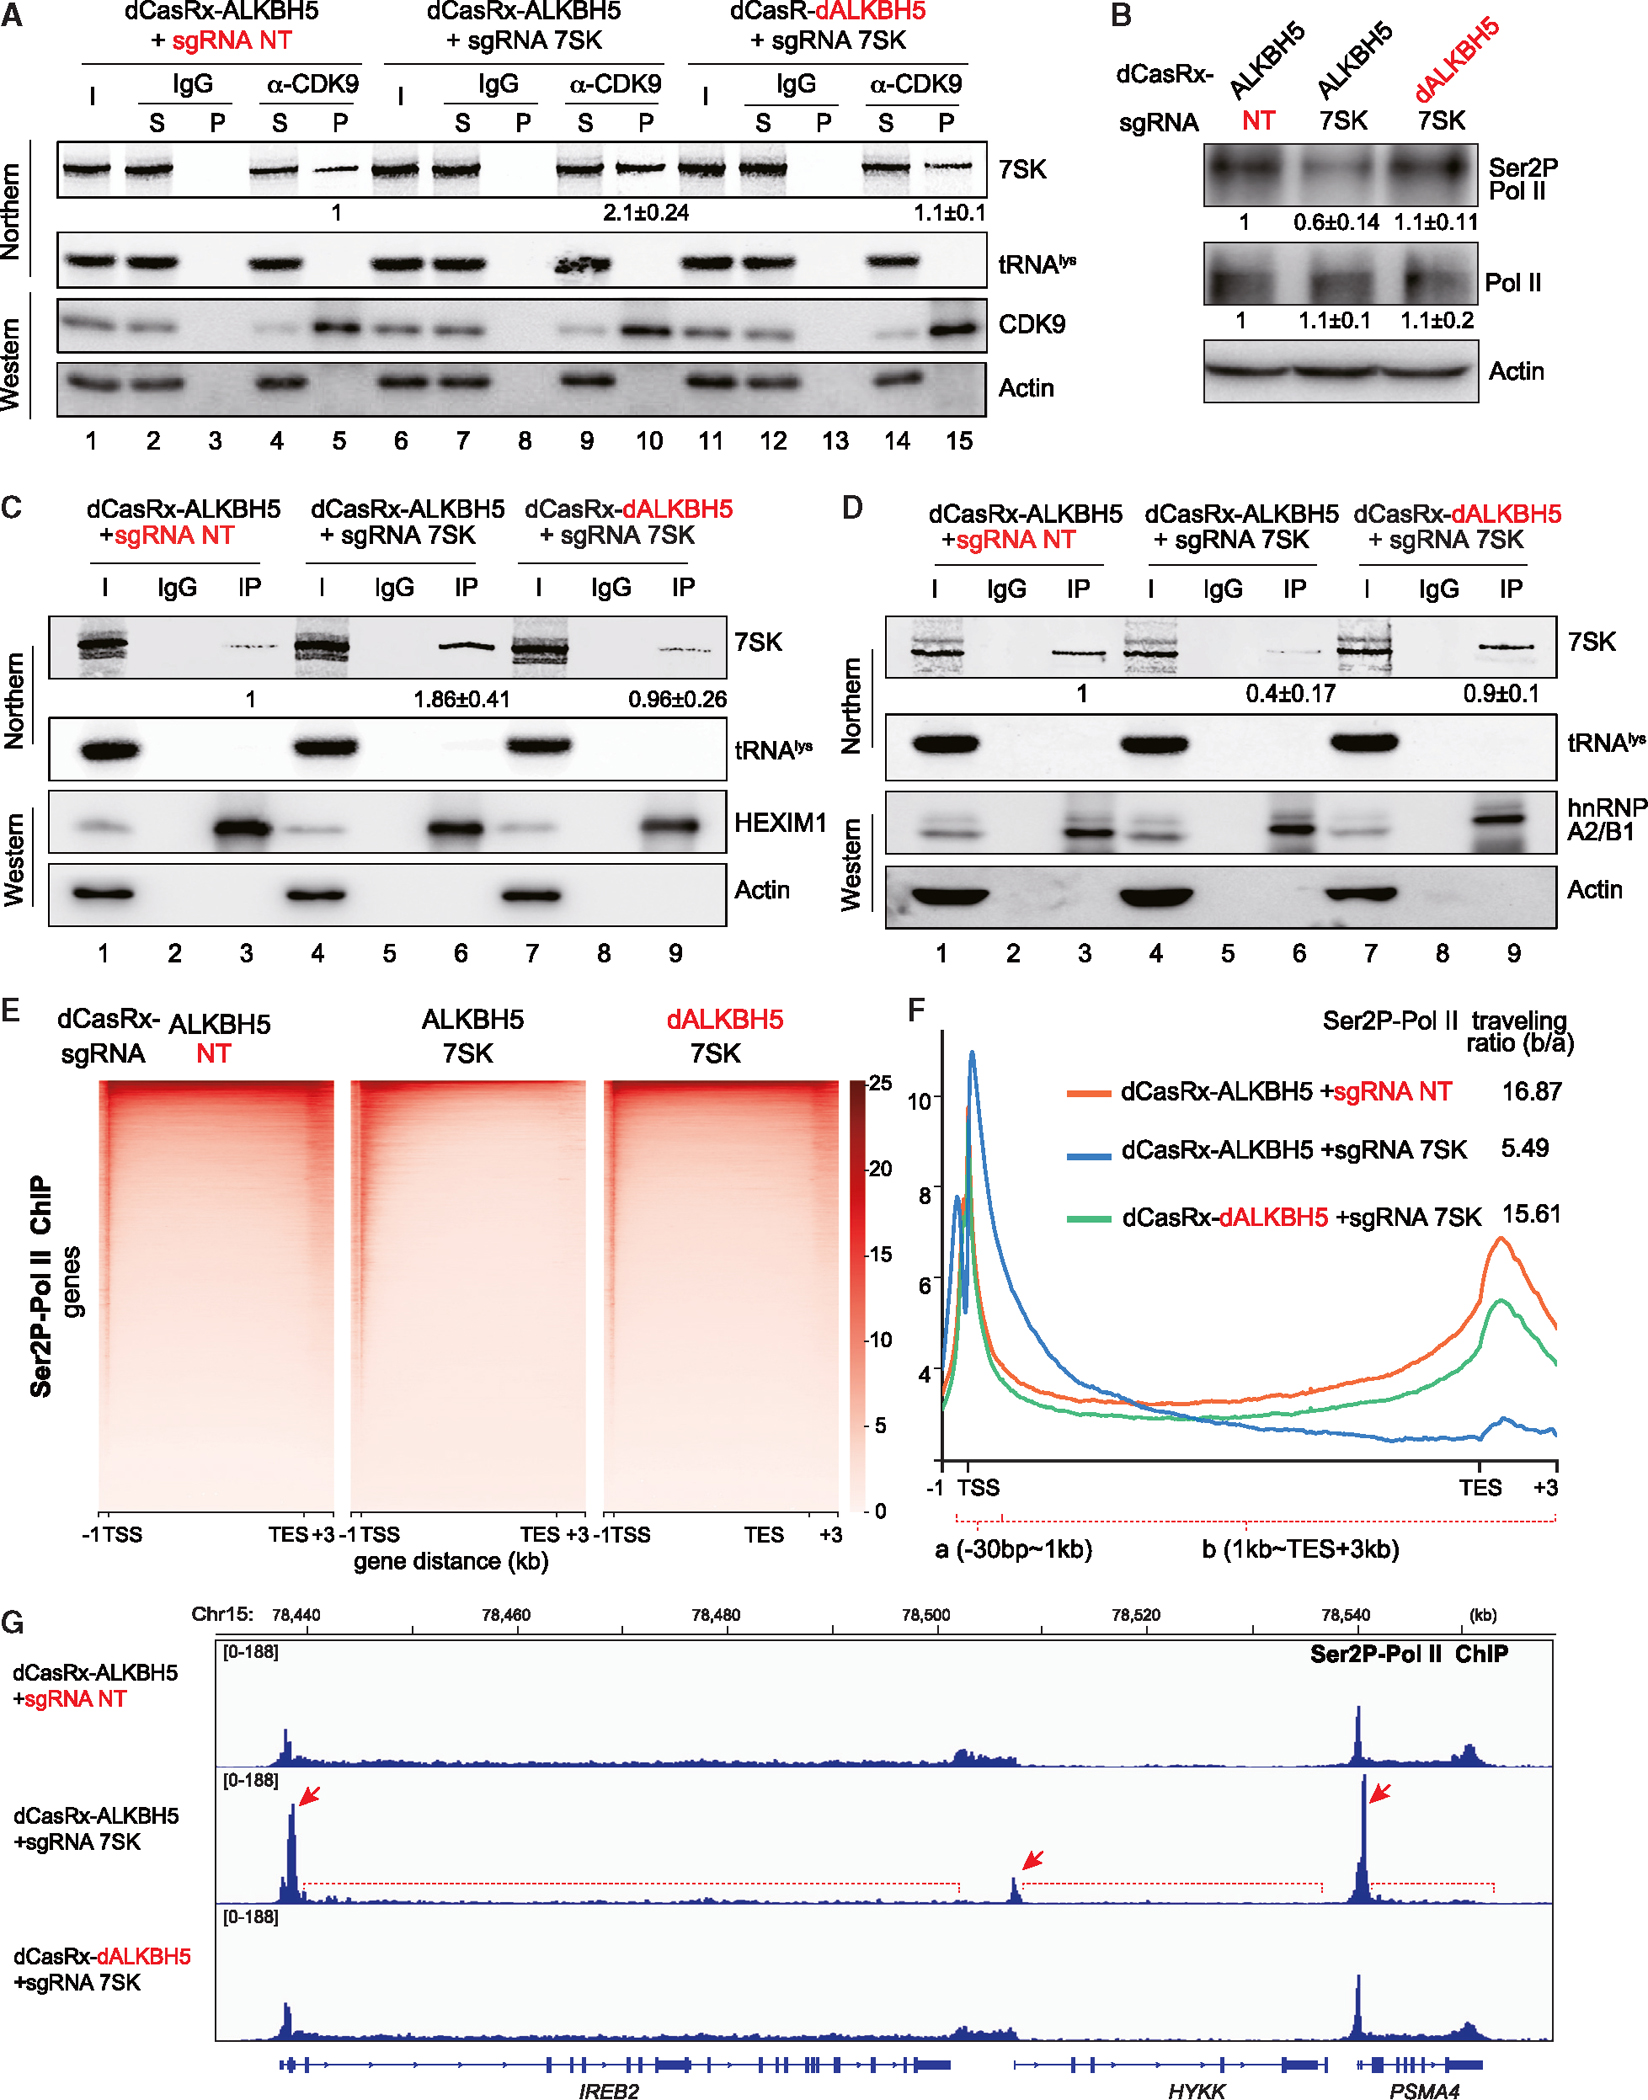
Figure 6. Reducing m6A modification of 7SK attenuates productive RNA Pol II elongation.

Experiments were performed in the engineered A549 cell lines stably expressing fusion dCasRx-ALKBH5 against 7SK and two control cell lines as in Figure 4. (A, C, and D) Northern blot analyses of 7SK and tRNAlys from RIP experiments performed using a CDK9 (A), HEXIM1 (C), and hnRNP A2B1 (D) antibodies or IgG. Western blots demonstrate IP efficiency. Inputs (I) are 5% of the pellet (P). Quantitation of relative m6A-7SK levels (mean ± SD) was derived from 3 independent experiments.
(B) Western blot of total RNA Pol II and Ser2P-RNA Pol II, with actin as a control. Quantitation of relative Ser2P-RNA Pol II and RNA Pol II levels (mean ± SD) were derived from 3 independent experiments.
(E) Heatmaps of Ser2P-RNA Pol II occupancy (ChIP relative to input), centered at the TSS (−1 to +3 kb).
(F) Metagene profiles of Ser2P-RNA Pol II ChIP, showing the distribution of Ser2P-RNA Pol II and the traveling ratio.
(G) Track examples of RNA Pol II Ser2P ChIP-seq in the region spanning genes IREB2, HYKK, and PSMA4. See also Figure S6.
