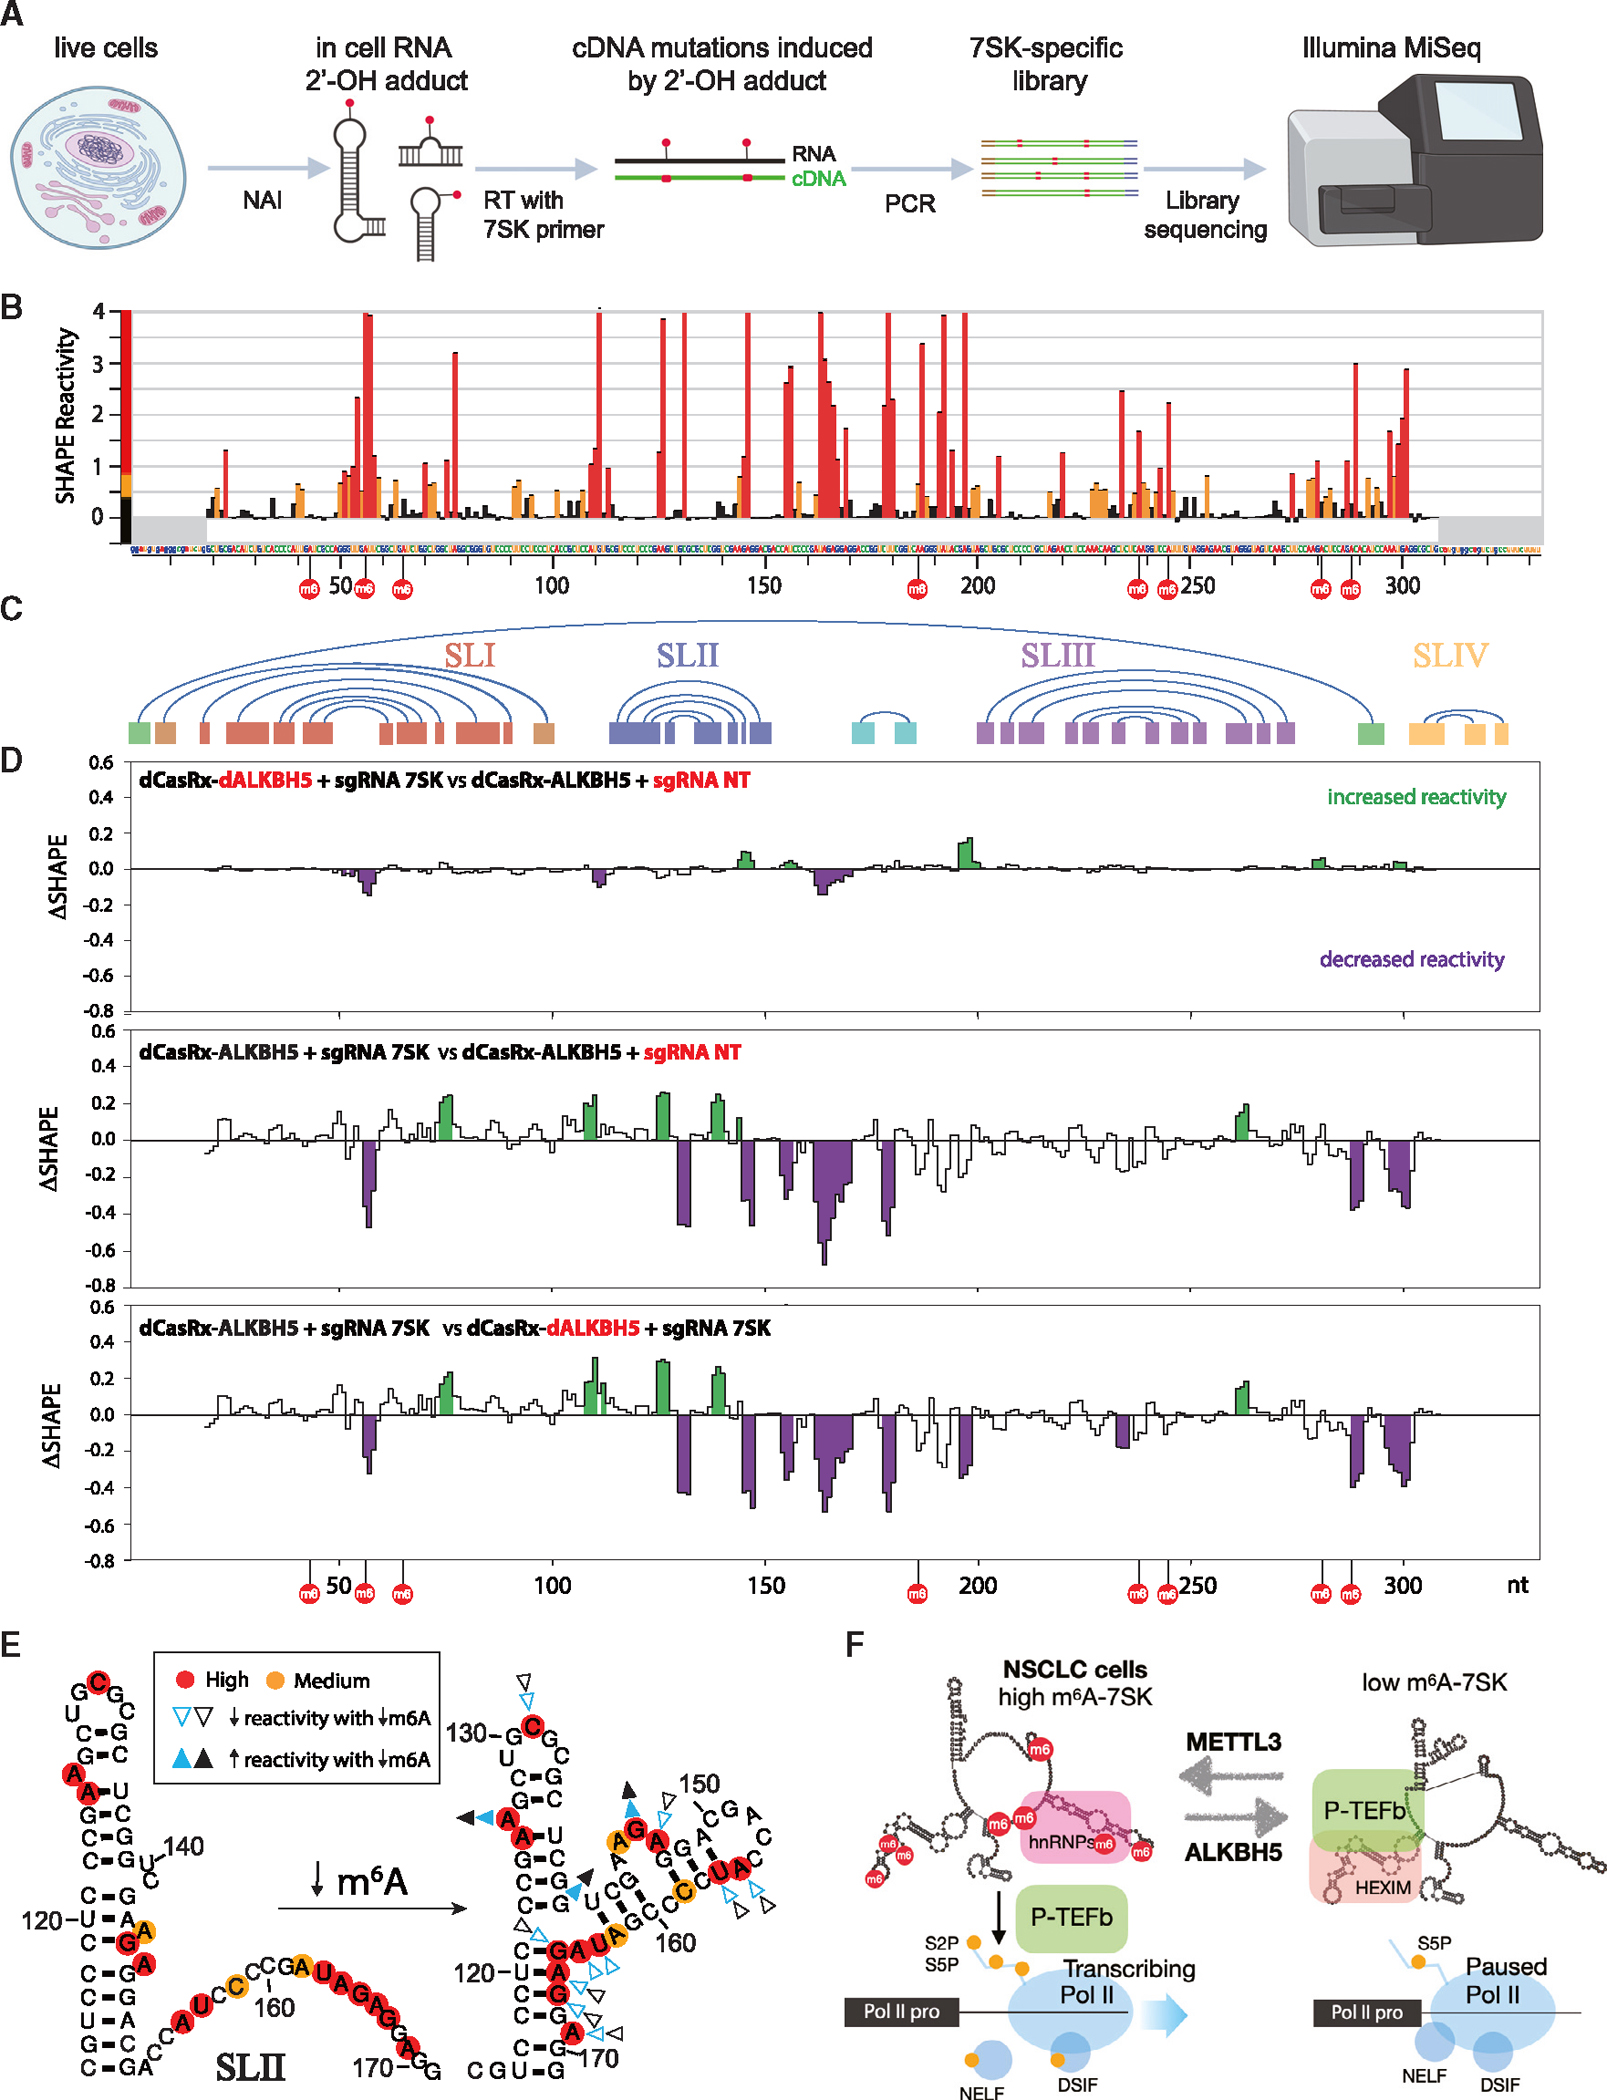
Figure 7. Structural switch of 7SK RNA upon modulation of m6A-7SK.

Experiments were performed in the engineered A549 cell lines stably expressing fusion dCasRx-ALKBH5 against 7SK and two control cell lines as in Figure 4. (A) Overview of SHAPE-MaP.
(B) Histogram profile depicting SHAPE-MaP reactivity of 7SK in A549 cells. The nucleotides and numbering across the x axis correspond to the reference sequence NR_001445. m6A sites are indicated by red circles. Highly reactive nucleotides are colored in red, medium in orange, and low in black. Regions that do not contain structural information due to primer binding (nt 1–18, 319–332) are shaded in gray. Error bars indicate SD from duplicate experiments.
(C) Graphic representation of interacting helices in a consensus model of 7SK. The region corresponding to SLI is shown in red, SLII in blue, SLIII in purple, SLIV inyellow, and the circularization helix in green.
(D) Pairwise ΔSHAPE analyses highlighting the differences between 3 SHAPE-MaP conditions. Analyses were performed with a sliding window of 3 nt and regions with increased reactivity are shaded in green, whereas decreased reactivity is shown in purple (p < 0.05).
(E) Comparison of 7SK SLII (nt 114–171) structures modeled with SHAPE-MaP activity and DSHAPE. High-reactivity positions are shown in red, and medium are in orange. The arrowheads show changes in reactivity upon reduction of m6A levels in 7SK. The colors (blue and black) represent 2 replicate experiments. Filled arrowheads indicate positions that become more reactive when m6A is decreased, whereas open arrowheads mark positions that are less reactive.
(F) Model of m6A-7SK-mediated RNA Pol II transcription activation. See also Figure S7.
