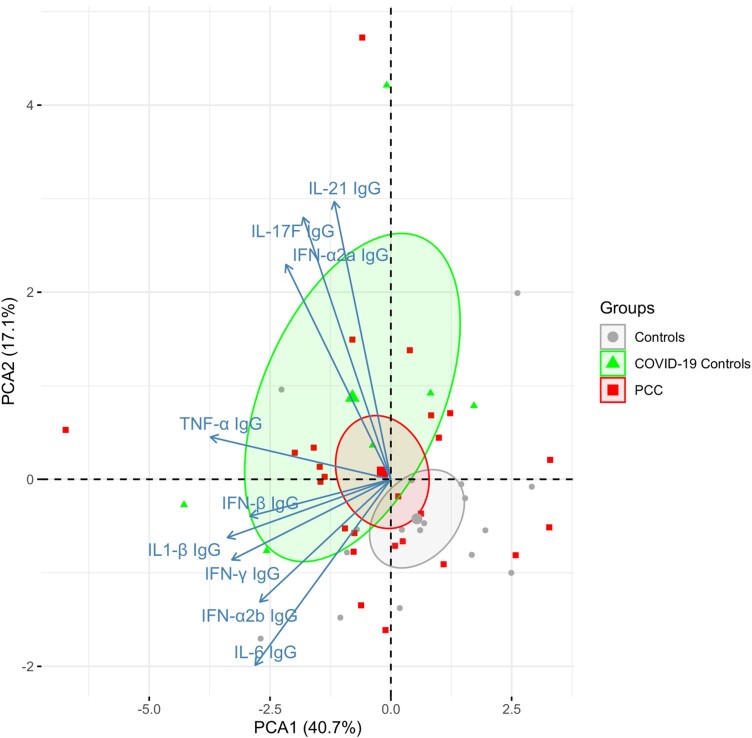
Figure 3.
Principal component analysis plot of 8 anti-cytokine autoantibodies in CSF. The centroids for each group are indicated and surrounded with ellipses indicating 95% confidence intervals. No difference between PCC and controls for PCA1 (P = .22). The percentages captured by principal components 1 and 2 are indicated. Abbreviations: COVID-19, coronavirus disease 2019; IFN, interferon; IgG, immunoglobulin G; IL, interleukin; PCA, principal component analysis; PCC, post-COVID condition; TNF-α, tumor necrosis factor-α.

