Figure 3.
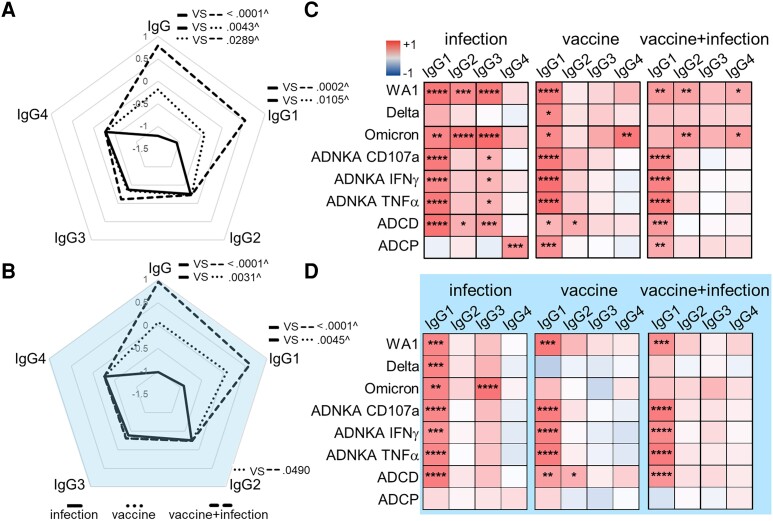
IgG1 is the primary subclass that drives antibody functions. Radar plots summarize the magnitude of RBD-specific IgG and subclass in (A) maternal and (B) matched cord blood. Each line represents the median Z-scored data for each group (infection n = 20, vaccine n = 18, vaccine + infection n = 27). P values are adjusted for maternal age and body mass index using linear regression. ^ Marks significance after adjustment for multiple comparisons by Benjamini-Hochberg. Heatmaps of the regression coefficients (r2) summarize the dependency of RBD-specific antibody functions on subclasses in (C) maternal and (D) cord blood by simple linear regression. *P ≤ .05, **P ≤ .01, ***P ≤ .001, ****P ≤ .0001. Abbreviations: IFN-γ, interferon-γ; IgG, immunoglobulin G; RBD, receptor-binding domain; TNF-α, tumor necrosis factor-α.

