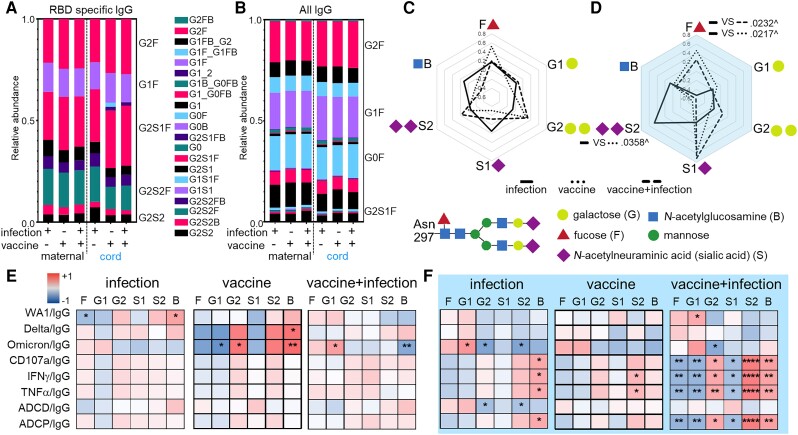
Figure 4.
Antibody glycosylation impacts functional potency. The relative abundance of (A) RBD-specific and (B) all IgG individual glycoforms are depicted. Radar plots summarize (C) maternal and (D) cord blood glycoforms from RBD relative to all IgG for each sample with lines showing the median Z-scored data for each group. P values are adjusted for maternal age and body mass index using linear regression. ^ Marks significance after adjustment for multiple comparisons by Benjamini-Hochberg. Heatmap of the regression coefficients (r2) summarizes the dependency of RBD-specific antibody function potency on RBD-specific IgG glycans in (E) maternal and (F) cord samples by simple linear regression. Fucosylated (F), monogalactosylated (G1), digalactosylated (G2), monosialylated (S1), disialylated (S2), and bisecting N-acetyl-glucosamine (B) glycoforms are shown. *P ≤ .05, **P ≤ .01, ***P ≤ .001, ****P ≤ .0001. Abbreviations: IFN-γ, interferon-γ; IgG, immunoglobulin G; RBD, receptor-binding domain; TNF-α, tumor necrosis factor-α.

