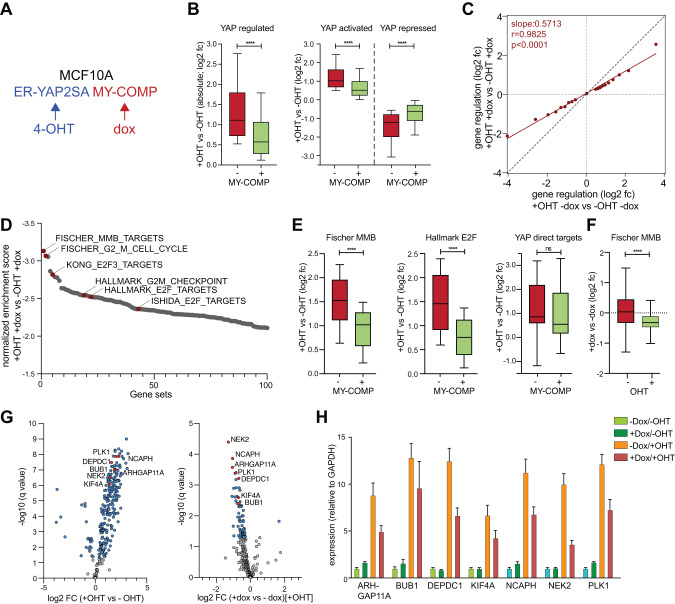
Fig. 3. Global effects of MY-COMP on the YAP-dependent transcriptional program.
A Scheme for MCF10A cells stably expressing ER-YAP2SA and doxycycline-inducible MY-COMP. B ER-YAP2SA/MY-COMP cells were treated with and without 4-OHT and with and without doxycycline. RNA was isolated and subjected to RNA-seq. Box plots documenting global effect of MY-COMP on YAP-mediated gene activation and repression. The plot on the left shows absolute values for all significantly YAP-regulated genes (padj < 0.01), plots on the right show the effect of MY-COMP on YAP-dependent gene activation and repression. Box plots extends from the 25th to 75th percentiles. A horizontal line indicates the median, whiskers extend to 10–90% percentile and outliers are not shown. P-values were calculated using two sided, paired Wilcoxon signed-rank tests. Number of genes in each gene set: YAP regulated: 5,421. YAP activated: 2,830. YAP: repressed: 2,591. See also Supplementary Table 3. C Correlation of YAP-dependent gene regulation in cell expressing and not expressing MY-COMP. Shown are the log2 fold-change (fc) values of gene regulation in cells after 4-OHT mediated activation of ER-YAP2SA. All YAP-regulated genes (padj < 0.01) were sorted for YAP regulation and binned into 20 bins with 271 genes each. A linear model was used to calculate a regression line. r2, r squared correlation coefficient. D Gene set enrichment analyses (GSEA) of RNA-seq data. Displayed are the normalized enrichment scores (NES) of the top 100 gene-sets downregulated by MY-COMP in the presence of 4-OHT. E Box plots documenting the effect of MY-COMP on YAP-mediated activation of the following gene set. Fischer MMB targets: MMB target genes from 10.1093/nar/gkw523 (172 genes). Hallmark E2F targets: https://www.gsea-msigdb.org/gsea/msigdb/cards/HALLMARK_E2F_TARGETS (169 genes). YAP bound: Most significant genes with YAP peak in +−1 kb around TSS YAP binding from [17]. Box plots were drawn as described in panel A. F Box plots documenting the effect of MY-COMP on MMB-target genes without (−) and with (+) activation of ER-YAP2SA by 4-OHT. G Volcano blots of RNA-seq data after induction of ER-YAP2SA (left) or after simultaneous expression of MY-COMP (right). q-values and fold change of MMB-target genes are plotted. 3 biological replicates per condition. H Activation by ER-YAP2SA and repression by MY-COMP of the indicated genes selected out of the MMB target genes shown in E was verified by RT-qPCR.

